

Question: thanks again Question 20 (5 points) () Listen When graphically displaying data, it is important to choose the correct method based Listen on the type
thanks again

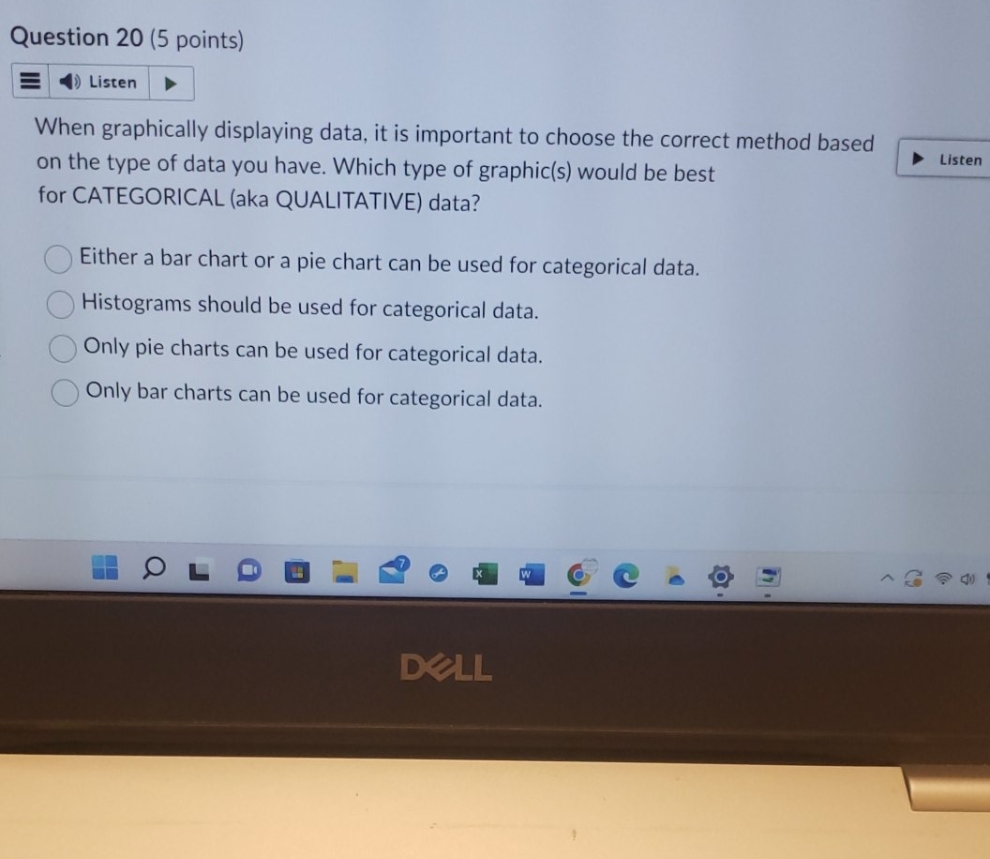
Question 20 (5 points) () Listen When graphically displaying data, it is important to choose the correct method based Listen on the type of data you have. Which type of graphic(s) would be best for CATEGORICAL (aka QUALITATIVE) data? Either a bar chart or a pie chart can be used for categorical data. Histograms should be used for categorical data. Only pie charts can be used for categorical data. Only bar charts can be used for categorical data. OLDBE W E DELL
Step by Step Solution
There are 3 Steps involved in it
1 Expert Approved Answer
Step: 1 Unlock

Question Has Been Solved by an Expert!
Get step-by-step solutions from verified subject matter experts
Step: 2 Unlock
Step: 3 Unlock