

Question: The following joint frequency distribution table shows responses from a sample of 242 unionized employees on how their union president handled a recent labour
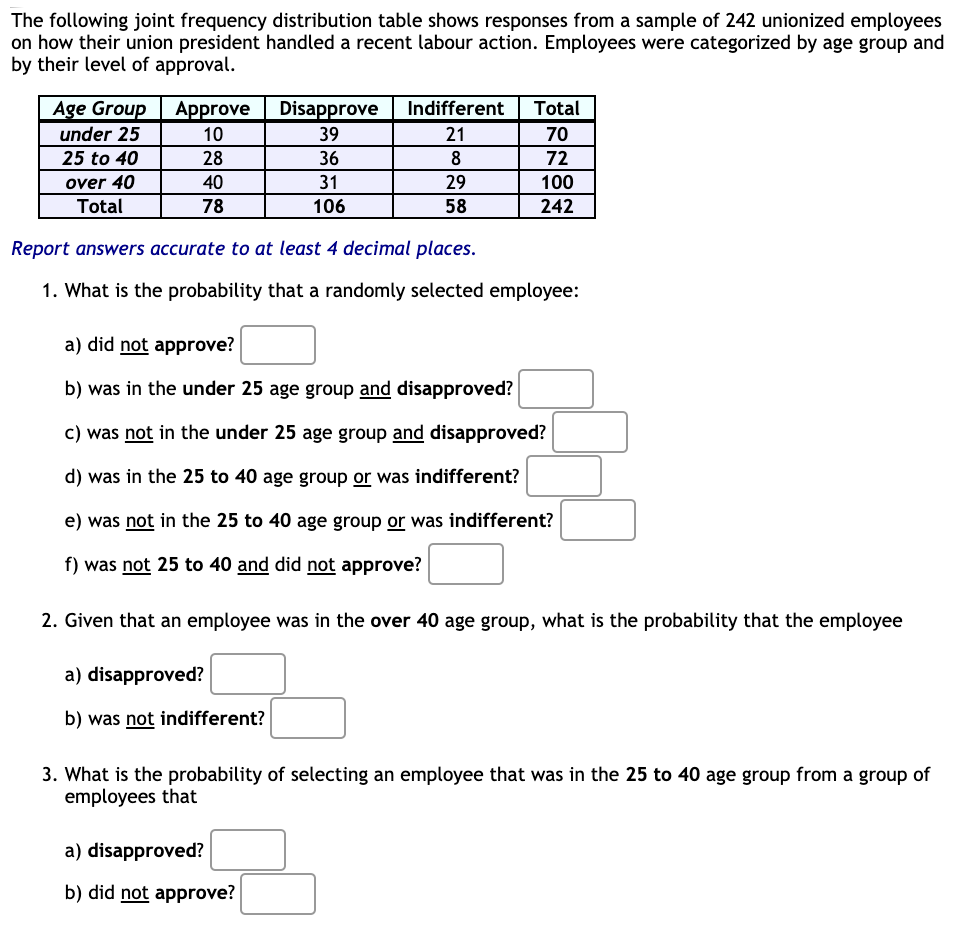
The following joint frequency distribution table shows responses from a sample of 242 unionized employees on how their union president handled a recent labour action. Employees were categorized by age group and by their level of approval. Age Group Approve Disapprove Indifferent Total under 25 10 39 21 70 25 to 40 28 36 8 72 over 40 40 31 29 100 Total 78 106 58 242 Report answers accurate to at least 4 decimal places. 1. What is the probability that a randomly selected employee: a) did not approve? b) was in the under 25 age group and disapproved? c) was not in the under 25 age group and disapproved? d) was in the 25 to 40 age group or was indifferent? e) was not in the 25 to 40 age group or was indifferent? f) was not 25 to 40 and did not approve? 2. Given that an employee was in the over 40 age group, what is the probability that the employee a) disapproved? b) was not indifferent? 3. What is the probability of selecting an employee that was in the 25 to 40 age group from a group of employees that a) disapproved? b) did not approve?
Step by Step Solution
There are 3 Steps involved in it
To solve this problem lets break it down step by step using the provided frequency distribution tabl... View full answer

Get step-by-step solutions from verified subject matter experts