

A pediatric clinic is interested in reducing the rate of missed opportunities to vaccinate its patients...
Fantastic news! We've Found the answer you've been seeking!
Question:
![Logistic regression model estimates: - Coef. Std. Err. Z P>z! [95% Conf. Interval] t! .0040216 -.149222 .0712193 -.715349 .01](https://dsd5zvtm8ll6.cloudfront.net/si.experts.images/questions/2020/09/5f631350ae587_1600155696152.jpg)
Transcribed Image Text:
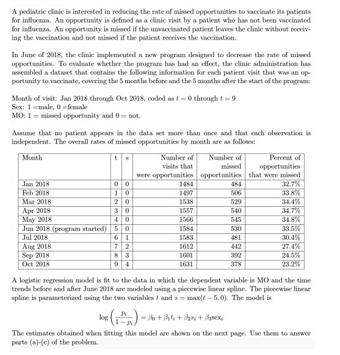
A pediatric clinic is interested in reducing the rate of missed opportunities to vaccinate its patients for info. An opportunity is defined as a clinic visit by a patient who has not been vaccinated for influenza. An opportunity is missed if the unvaccinated patient leaves the clinic without receiv ing the vaccination and not missed if the patient receives the vaccination. In June of 2018, the clinic implemented a new program designed to decrease the rate of mid opportunities. To evaluate whether the program has had an effect, the clinic administration has assembled a dates that contains the following information for each patient visit that was an op- portunity to vaccinate, covering the 5 months before and the 5 months after the start of the progra Mouth of visit: Jan 2018 through Oct 2018, coded as through t Sex: 1 male, female MO: 1-missed opportunity and not. Assume that no patient appears in the data set more than once and that each observation independent. The overall rates of missed opportunities by month are as follow Month Number of visits that Number of missed Percent of opportunities were opportunities opportunities that were missed Jan 2018 00 1454 484 32.7% Feb 2018 10 1857 506 33.8% Mar 2018 20 1538 529 34.4% Apr 2018 30 1557 540 34.7% May 2018 40 1566 545 34.8% Jun 2018 (program started) 50 1584 530 33.5% Jul 2018 61 1583 481 30.4% Aug 2018 72 1612 442 27.4% Sep 2018 83 1001 392 24.5% Oct 2018 1631 378 23.26 A logistic regression model is fit to the data in which the dependent variable is MO and the time trends before and after June 2018 are modeled using a piecewise linear spline. The piecewise line spline is parameterized using the two variables and max(-5,0). The model is ()- +++ The estimates obtained when fitting this model are shown on the next page. Use them to answer parts (a)-(c) of the problem Logistic regression model estimates: | Coef. Std. Err. Z P>|z| [95% Conf. Interval] tl .0040216 .0117921 s | -.149222 .0243438 0.34 -6.13 0.000 0.733 -.0190905 .0271337 -.196935 -.101509 sex | intercept | .0712193 -.715349 .0347585 2.05 0.040 .0030939 .1393447 .0425485 -16.81 0.000 -.7987425 -.6319555 (a) Provide the odds ratio for sex, along with a brief interpretation. (b) According to the model results, what is the probability that a visit by a male patient in March 2018 was a missed opportunity? (c) Is there evidence from the logistic modeling results that the probability of a missed oppor- tunity decreased after the program was implemented? Support your answer with a careful interpretation of the coefficients of t and s and their signs and significance. Explain how you could formally test whether the rate of missed opportunities has been decreasing over the period from June 2018 to October 2018. (d) Now suppose that instead of using t and s as continous predictors, a model is fit treating t as a categorical variable. The corresponding dummy variables will be constructed so that t=0 is the reference category and d; = 1 if t = j and d; = 0 otherwise, for j = 1,2...,9. The corresponding model is Pi log ... + Badg,i+ B10sexi Bo+Bidi,i+4 Explain how to test whether the average log odds of a missed opportunity for months February through May 2018 (t = 1 to 4) is equal to the average log odds of a missed opportunity for the months July through October 2018 (t = 6 to 9), using this model and a linear contrast. Explain what a significant test would tell you about the success of the program and how this differs conceptually from part (c). A pediatric clinic is interested in reducing the rate of missed opportunities to vaccinate its patients for info. An opportunity is defined as a clinic visit by a patient who has not been vaccinated for influenza. An opportunity is missed if the unvaccinated patient leaves the clinic without receiv ing the vaccination and not missed if the patient receives the vaccination. In June of 2018, the clinic implemented a new program designed to decrease the rate of mid opportunities. To evaluate whether the program has had an effect, the clinic administration has assembled a dates that contains the following information for each patient visit that was an op- portunity to vaccinate, covering the 5 months before and the 5 months after the start of the progra Mouth of visit: Jan 2018 through Oct 2018, coded as through t Sex: 1 male, female MO: 1-missed opportunity and not. Assume that no patient appears in the data set more than once and that each observation independent. The overall rates of missed opportunities by month are as follow Month Number of visits that Number of missed Percent of opportunities were opportunities opportunities that were missed Jan 2018 00 1454 484 32.7% Feb 2018 10 1857 506 33.8% Mar 2018 20 1538 529 34.4% Apr 2018 30 1557 540 34.7% May 2018 40 1566 545 34.8% Jun 2018 (program started) 50 1584 530 33.5% Jul 2018 61 1583 481 30.4% Aug 2018 72 1612 442 27.4% Sep 2018 83 1001 392 24.5% Oct 2018 1631 378 23.26 A logistic regression model is fit to the data in which the dependent variable is MO and the time trends before and after June 2018 are modeled using a piecewise linear spline. The piecewise line spline is parameterized using the two variables and max(-5,0). The model is ()- +++ The estimates obtained when fitting this model are shown on the next page. Use them to answer parts (a)-(c) of the problem Logistic regression model estimates: | Coef. Std. Err. Z P>|z| [95% Conf. Interval] tl .0040216 .0117921 s | -.149222 .0243438 0.34 -6.13 0.000 0.733 -.0190905 .0271337 -.196935 -.101509 sex | intercept | .0712193 -.715349 .0347585 2.05 0.040 .0030939 .1393447 .0425485 -16.81 0.000 -.7987425 -.6319555 (a) Provide the odds ratio for sex, along with a brief interpretation. (b) According to the model results, what is the probability that a visit by a male patient in March 2018 was a missed opportunity? (c) Is there evidence from the logistic modeling results that the probability of a missed oppor- tunity decreased after the program was implemented? Support your answer with a careful interpretation of the coefficients of t and s and their signs and significance. Explain how you could formally test whether the rate of missed opportunities has been decreasing over the period from June 2018 to October 2018. (d) Now suppose that instead of using t and s as continous predictors, a model is fit treating t as a categorical variable. The corresponding dummy variables will be constructed so that t=0 is the reference category and d; = 1 if t = j and d; = 0 otherwise, for j = 1,2...,9. The corresponding model is Pi log ... + Badg,i+ B10sexi Bo+Bidi,i+4 Explain how to test whether the average log odds of a missed opportunity for months February through May 2018 (t = 1 to 4) is equal to the average log odds of a missed opportunity for the months July through October 2018 (t = 6 to 9), using this model and a linear contrast. Explain what a significant test would tell you about the success of the program and how this differs conceptually from part (c). A pediatric clinic is interested in reducing the rate of missed opportunities to vaccinate its patients for info. An opportunity is defined as a clinic visit by a patient who has not been vaccinated for influenza. An opportunity is missed if the unvaccinated patient leaves the clinic without receiv ing the vaccination and not missed if the patient receives the vaccination. In June of 2018, the clinic implemented a new program designed to decrease the rate of mid opportunities. To evaluate whether the program has had an effect, the clinic administration has assembled a dates that contains the following information for each patient visit that was an op- portunity to vaccinate, covering the 5 months before and the 5 months after the start of the progra Mouth of visit: Jan 2018 through Oct 2018, coded as through t Sex: 1 male, female MO: 1-missed opportunity and not. Assume that no patient appears in the data set more than once and that each observation independent. The overall rates of missed opportunities by month are as follow Month Number of visits that Number of missed Percent of opportunities were opportunities opportunities that were missed Jan 2018 00 1454 484 32.7% Feb 2018 10 1857 506 33.8% Mar 2018 20 1538 529 34.4% Apr 2018 30 1557 540 34.7% May 2018 40 1566 545 34.8% Jun 2018 (program started) 50 1584 530 33.5% Jul 2018 61 1583 481 30.4% Aug 2018 72 1612 442 27.4% Sep 2018 83 1001 392 24.5% Oct 2018 1631 378 23.26 A logistic regression model is fit to the data in which the dependent variable is MO and the time trends before and after June 2018 are modeled using a piecewise linear spline. The piecewise line spline is parameterized using the two variables and max(-5,0). The model is ()- +++ The estimates obtained when fitting this model are shown on the next page. Use them to answer parts (a)-(c) of the problem Logistic regression model estimates: | Coef. Std. Err. Z P>|z| [95% Conf. Interval] tl .0040216 .0117921 s | -.149222 .0243438 0.34 -6.13 0.000 0.733 -.0190905 .0271337 -.196935 -.101509 sex | intercept | .0712193 -.715349 .0347585 2.05 0.040 .0030939 .1393447 .0425485 -16.81 0.000 -.7987425 -.6319555 (a) Provide the odds ratio for sex, along with a brief interpretation. (b) According to the model results, what is the probability that a visit by a male patient in March 2018 was a missed opportunity? (c) Is there evidence from the logistic modeling results that the probability of a missed oppor- tunity decreased after the program was implemented? Support your answer with a careful interpretation of the coefficients of t and s and their signs and significance. Explain how you could formally test whether the rate of missed opportunities has been decreasing over the period from June 2018 to October 2018. (d) Now suppose that instead of using t and s as continous predictors, a model is fit treating t as a categorical variable. The corresponding dummy variables will be constructed so that t=0 is the reference category and d; = 1 if t = j and d; = 0 otherwise, for j = 1,2...,9. The corresponding model is Pi log ... + Badg,i+ B10sexi Bo+Bidi,i+4 Explain how to test whether the average log odds of a missed opportunity for months February through May 2018 (t = 1 to 4) is equal to the average log odds of a missed opportunity for the months July through October 2018 (t = 6 to 9), using this model and a linear contrast. Explain what a significant test would tell you about the success of the program and how this differs conceptually from part (c). A pediatric clinic is interested in reducing the rate of missed opportunities to vaccinate its patients for info. An opportunity is defined as a clinic visit by a patient who has not been vaccinated for influenza. An opportunity is missed if the unvaccinated patient leaves the clinic without receiv ing the vaccination and not missed if the patient receives the vaccination. In June of 2018, the clinic implemented a new program designed to decrease the rate of mid opportunities. To evaluate whether the program has had an effect, the clinic administration has assembled a dates that contains the following information for each patient visit that was an op- portunity to vaccinate, covering the 5 months before and the 5 months after the start of the progra Mouth of visit: Jan 2018 through Oct 2018, coded as through t Sex: 1 male, female MO: 1-missed opportunity and not. Assume that no patient appears in the data set more than once and that each observation independent. The overall rates of missed opportunities by month are as follow Month Number of visits that Number of missed Percent of opportunities were opportunities opportunities that were missed Jan 2018 00 1454 484 32.7% Feb 2018 10 1857 506 33.8% Mar 2018 20 1538 529 34.4% Apr 2018 30 1557 540 34.7% May 2018 40 1566 545 34.8% Jun 2018 (program started) 50 1584 530 33.5% Jul 2018 61 1583 481 30.4% Aug 2018 72 1612 442 27.4% Sep 2018 83 1001 392 24.5% Oct 2018 1631 378 23.26 A logistic regression model is fit to the data in which the dependent variable is MO and the time trends before and after June 2018 are modeled using a piecewise linear spline. The piecewise line spline is parameterized using the two variables and max(-5,0). The model is ()- +++ The estimates obtained when fitting this model are shown on the next page. Use them to answer parts (a)-(c) of the problem Logistic regression model estimates: | Coef. Std. Err. Z P>|z| [95% Conf. Interval] tl .0040216 .0117921 s | -.149222 .0243438 0.34 -6.13 0.000 0.733 -.0190905 .0271337 -.196935 -.101509 sex | intercept | .0712193 -.715349 .0347585 2.05 0.040 .0030939 .1393447 .0425485 -16.81 0.000 -.7987425 -.6319555 (a) Provide the odds ratio for sex, along with a brief interpretation. (b) According to the model results, what is the probability that a visit by a male patient in March 2018 was a missed opportunity? (c) Is there evidence from the logistic modeling results that the probability of a missed oppor- tunity decreased after the program was implemented? Support your answer with a careful interpretation of the coefficients of t and s and their signs and significance. Explain how you could formally test whether the rate of missed opportunities has been decreasing over the period from June 2018 to October 2018. (d) Now suppose that instead of using t and s as continous predictors, a model is fit treating t as a categorical variable. The corresponding dummy variables will be constructed so that t=0 is the reference category and d; = 1 if t = j and d; = 0 otherwise, for j = 1,2...,9. The corresponding model is Pi log ... + Badg,i+ B10sexi Bo+Bidi,i+4 Explain how to test whether the average log odds of a missed opportunity for months February through May 2018 (t = 1 to 4) is equal to the average log odds of a missed opportunity for the months July through October 2018 (t = 6 to 9), using this model and a linear contrast. Explain what a significant test would tell you about the success of the program and how this differs conceptually from part (c).
Expert Answer:
Answer rating: 100% (QA)
According to the information provided in the image the company is interested in analyzing the rate of missed opportunities to improve efficiency The d... View the full answer

Related Book For 

Posted Date:
Students also viewed these mathematics questions
-
A major automobile company is interested in reducing the time that customers have to wait while having their car serviced with one of the dealers. They select four customers randomly each day and...
-
A major automobile company is interested in reducing the time that customers have to wait while having their car serviced with one of the dealers. They select four customers randomly each day and...
-
A manufacturer of magnetic tapes is interested in reducing the variability of the thickness of the coating on the tape. It is estimated that the loss to the consumer is $10 per reel if the thickness...
-
At one time the Thames River in England supported an abundant community of fish. Pollution then destroyed all the fish in a 40-mile stretch near its mouth for a 45-year period beginning in 1915....
-
Construct a binomial setting (different from any examples presented in this book) and a problem for which the following is the answer: 7C3 (0.8)3(0.2)4.
-
Depreciation expense does not require payment in cash. However, it is an important consideration in the discounting of an investment's future cash flows. Explain why.
-
Show that an alternate computing formula for the regression sum of squares in a linear regression model is \[S S_{\mathrm{R}}=\sum_{i=1}^{n} \hat{y}_{i}^{2}-n \bar{y}^{2}\]
-
In Russ Nelsons comments to Charlie, he recommends that Charlie block RICC employees from accessing social media sites such as Facebook and Twitter from their computers at work. What are the...
-
A company has 5 3 6 4 2 3 8 shares outstanding and the stock sells at $ 8 4 . 6 4 per share. What is the market value of equity?
-
The bond equivalent yield of a 91-day T-bill is 5%. What is the price of the bill for a $10,000 face value?
-
Think of a real-life organization in which you find clear evidence of discrimination/bias against women, or LGBTQI+ people, or people of color, or people from impoverished backgrounds. Remember that...
-
Isabel has 64 miles remaining after 38 minutes of driving. How many miles will be remaining after 56 minutes of driving? Remaining distance (in miles )
-
Your cellphone plan is by the minute. Each minute of use costs $0.10. Create a relation that represents the amount spent, A, per minute, m, of call time. Then, use the relation to find the amount...
-
Trevor scored an 84 on the test. The equation 100-2x=84, where x represents the number of questions answered incorrectly, represents the situation. How many questions did Trevor answer incorrectly?
-
2. Digital trade has become increasingly important, including trade among Asian economies and U.S.- Asia trade. In addition, digital firms and digital start-ups are increasingly relevant in Asia....
-
Saint Joseph Hospital buys 600 boxes of latex gloves every year. Each box costs the hospital $8. The cost to place an order for the gloveswhich covers the employee staff time, shipping costs, and the...
-
On each occasion, complete the following actions to prepare to collect data: 1. Consult with relevant personnel to confirm the task requirements. 2. Identify the source data. This must include at...
-
Consider the setup in Problem 16. Show that the relative speed of the ball and the point of contact on the stick is the same before and immediately after the collision. (This result is analogous to...
-
Here is the stress level (scored 1-10, with higher scores = higher stress) for college freshmen during the first week of classes, middle week of classes, and last week of classes: a. Create three...
-
"Everyone knows" that certain college majors are associated with larger salaries for graduates. Is that really so? Here are the annual salaries (in thousands of dollars) for 8 randomly selected...
-
Examine the following ANOVA summary table: b. Assuming equal numbers of subjects per group, how many subjects were in each group? c. What is the tabled critical value of F at the .01 level? d. What...
-
What is the pro forma statement, and how important is it for a business?
-
Briefly compare replacement value to liquidation value of an asset.
-
Briefly describe what quality control is all about, and explain the three statistical types of control.

Study smarter with the SolutionInn App