

Question: That is the question I need help, please Suppose z is the standard normal variable. Draw the normal curve for each of the following probability
That is the question I need help, please
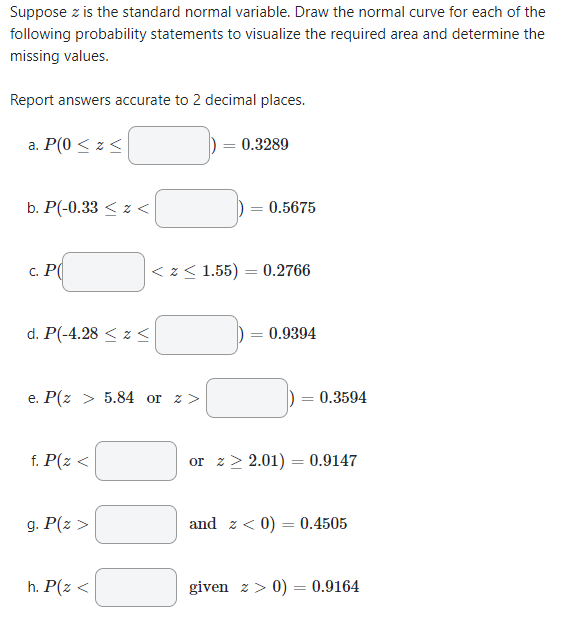
Suppose z is the standard normal variable. Draw the normal curve for each of the following probability statements to visualize the required area and determine the missing values. Report answers accurate to 2 decimal places. a. P0 2 0.3289 b. P(-0.332 = 0.5675 c. P( 5.84 or > > - 0.3594 f. P(z or > > 2.01) = 0.9147 g. P(2 > and > >0) = 0.9164
Step by Step Solution
There are 3 Steps involved in it
1 Expert Approved Answer
Step: 1 Unlock

Question Has Been Solved by an Expert!
Get step-by-step solutions from verified subject matter experts
Step: 2 Unlock
Step: 3 Unlock