

Question: Suppose z is the standard normal variable. Draw the normal curve for each of the following probability statements to visualize the required area and determine
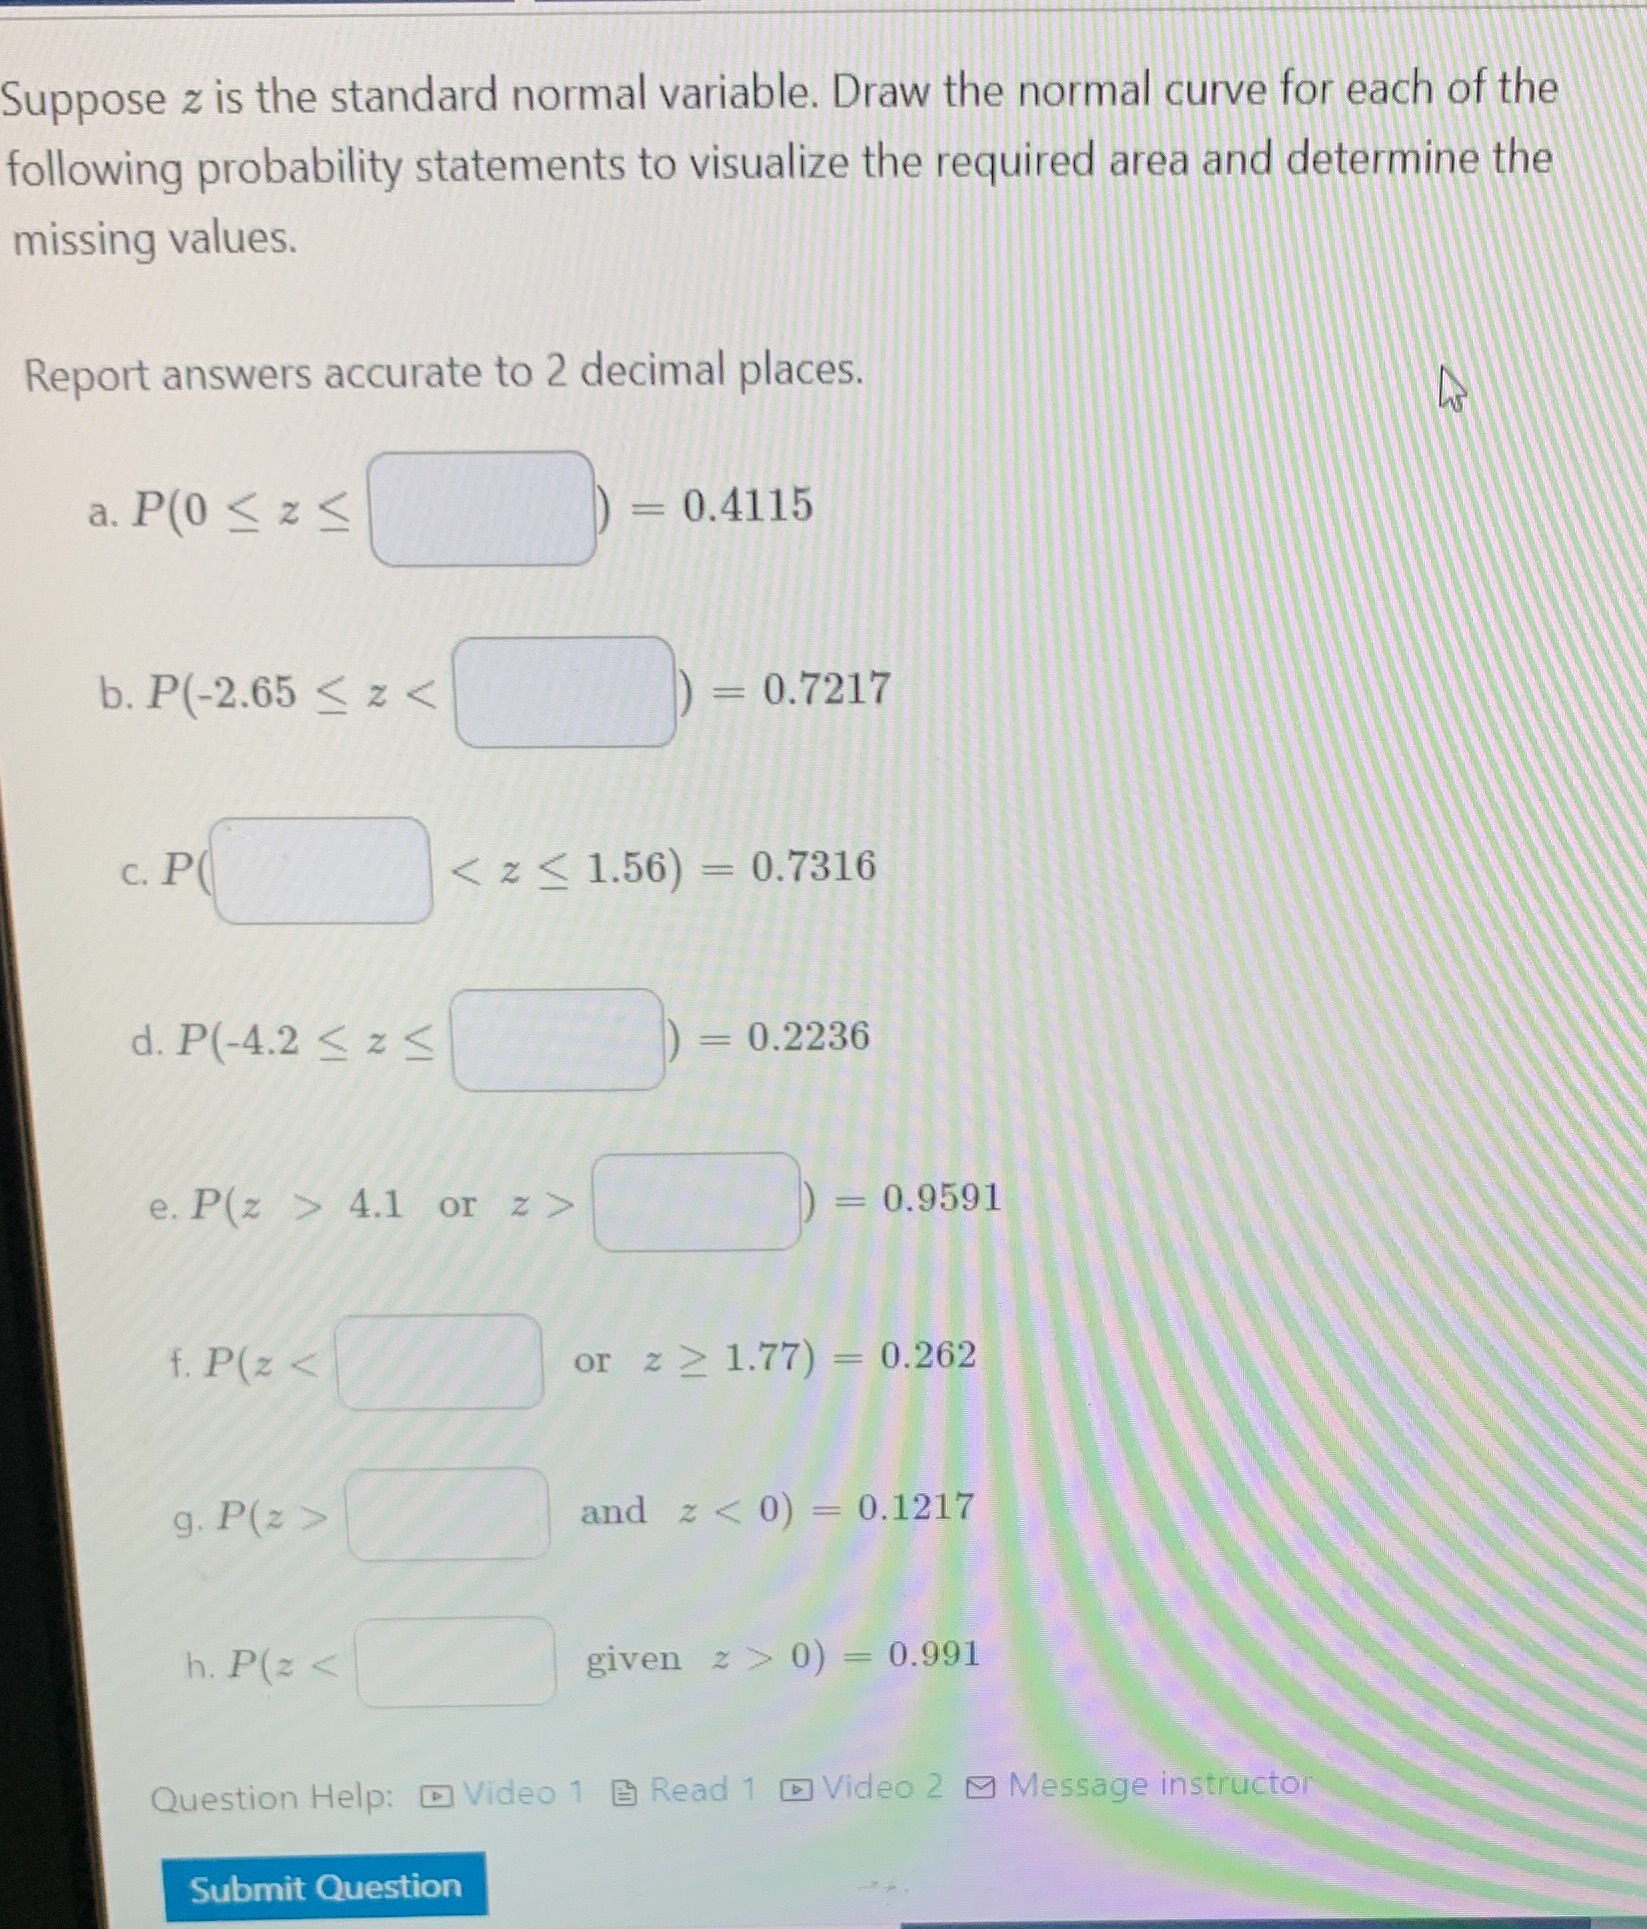
Suppose z is the standard normal variable. Draw the normal curve for each of the following probability statements to visualize the required area and determine the missing values. Report answers accurate to 2 decimal places. a. P(0 4.1 or z > = 0.9591 f. P (z 1.77) = 0.262 g. P(z > and z 0) = 0.991 Question Help: @Video 1 B Read 1 () Video 2 ) Message instructor Submit
Step by Step Solution
There are 3 Steps involved in it
1 Expert Approved Answer
Step: 1 Unlock

Question Has Been Solved by an Expert!
Get step-by-step solutions from verified subject matter experts
Step: 2 Unlock
Step: 3 Unlock