

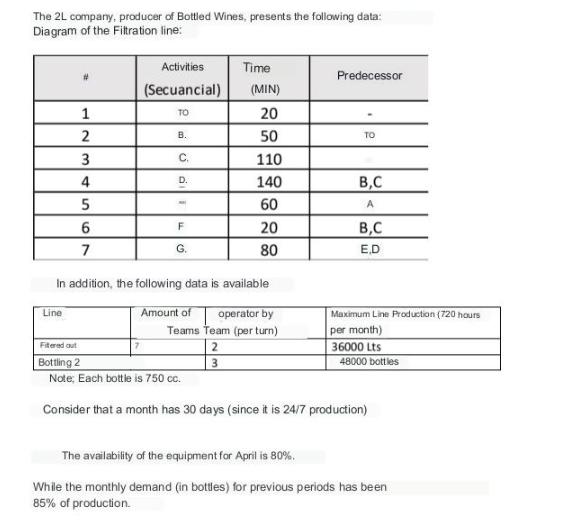
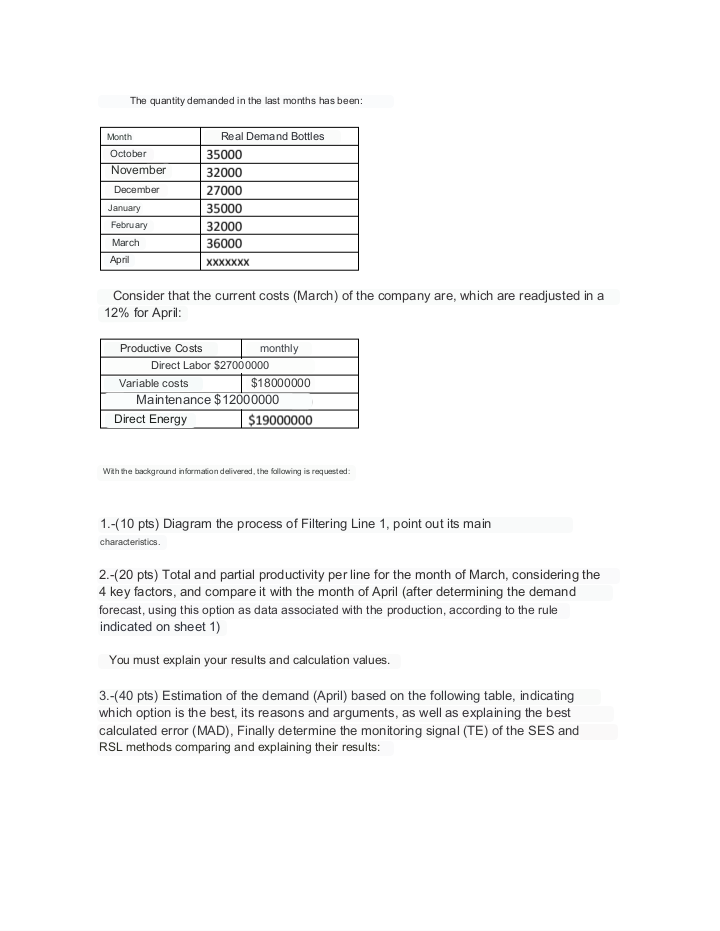
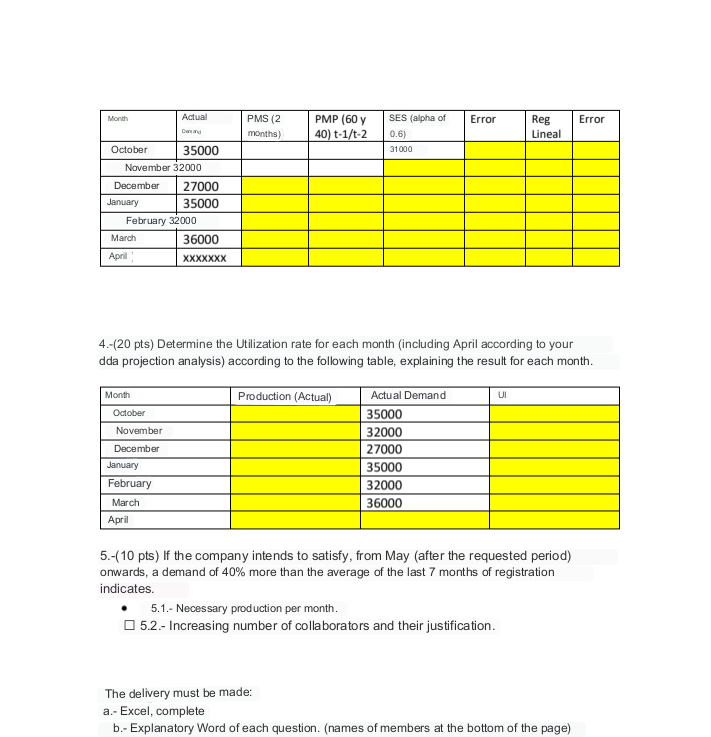
The 2L company, producer of Bottled Wines, presents the following data: Diagram of the Filtration line:...
Fantastic news! We've Found the answer you've been seeking!
Question:
Transcribed Image Text:
The 2L company, producer of Bottled Wines, presents the following data: Diagram of the Filtration line: 1 2 3 4 5 6 7 Line Activities (Secuancial) TO B. C. D. M F Time (MIN) 20 50 110 140 60 20 80 In addition, the following data is available Amount of operator by Teams Team (per turn) 2 3 Predecessor TO B,C A B,C E.D Maximum Line Production (720 hours per month) 36000 Lts Fitered out Bottling 2 Note: Each bottle is 750 cc. Consider that a month has 30 days (since it is 24/7 production) 48000 bottles The availability of the equipment for April is 80%. While the monthly demand (in bottles) for previous periods has been 85% of production. The quantity demanded in the last months has been: Month October November December January February March April Productive Costs Real Demand Bottles Consider that the current costs (March) of the company are, which are readjusted in a 12% for April: Variable costs 35000 32000 27000 35000 32000 36000 XXXXXXX Direct Energy Direct Labor $27000000 monthly $18000000 Maintenance $12000000 $19000000 With the background information delivered, the following is requested: 1.-(10 pts) Diagram the process of Filtering Line 1, point out its main characteristics. 2.-(20 pts) Total and partial productivity per line for the month of March, considering the 4 key factors, and compare it with the month of April (after determining the demand forecast, using this option as data associated with the production, according to the rule indicated on sheet 1) You must explain your results and calculation values. 3.-(40 pts) Estimation of the demand (April) based on the following table, indicating which option is the best, its reasons and arguments, as well as explaining the best calculated error (MAD), Finally determine the monitoring signal (TE) of the SES and RSL methods comparing and explaining their results: Month October December November 32000 January March April February 32000 Month Actual Dan and October November December 35000 January February March April 27000 35000 36000 XXXXXXX PMS (2 months) PMP (60 y 40) t-1/t-2 SES (alpha of 0.6) 31000 4.-(20 pts) Determine the Utilization rate for each month (including April according to your dda projection analysis) according to the following table, explaining the result for each month. Production (Actual) Error Actual Demand 35000 32000 27000 35000 32000 36000 Reg Lineal UI 5.1.- Necessary production per month. 5.2.- Increasing number of collaborators and their justification. 5.-(10 pts) If the company intends to satisfy, from May (after the requested period) onwards, a demand of 40% more than the average of the last 7 months of registration indicates. Error The delivery must be made: a.- Excel, complete b.- Explanatory Word of each question. (names of members at the bottom of the page) The 2L company, producer of Bottled Wines, presents the following data: Diagram of the Filtration line: 1 2 3 4 5 6 7 Line Activities (Secuancial) TO B. C. D. M F Time (MIN) 20 50 110 140 60 20 80 In addition, the following data is available Amount of operator by Teams Team (per turn) 2 3 Predecessor TO B,C A B,C E.D Maximum Line Production (720 hours per month) 36000 Lts Fitered out Bottling 2 Note: Each bottle is 750 cc. Consider that a month has 30 days (since it is 24/7 production) 48000 bottles The availability of the equipment for April is 80%. While the monthly demand (in bottles) for previous periods has been 85% of production. The quantity demanded in the last months has been: Month October November December January February March April Productive Costs Real Demand Bottles Consider that the current costs (March) of the company are, which are readjusted in a 12% for April: Variable costs 35000 32000 27000 35000 32000 36000 XXXXXXX Direct Energy Direct Labor $27000000 monthly $18000000 Maintenance $12000000 $19000000 With the background information delivered, the following is requested: 1.-(10 pts) Diagram the process of Filtering Line 1, point out its main characteristics. 2.-(20 pts) Total and partial productivity per line for the month of March, considering the 4 key factors, and compare it with the month of April (after determining the demand forecast, using this option as data associated with the production, according to the rule indicated on sheet 1) You must explain your results and calculation values. 3.-(40 pts) Estimation of the demand (April) based on the following table, indicating which option is the best, its reasons and arguments, as well as explaining the best calculated error (MAD), Finally determine the monitoring signal (TE) of the SES and RSL methods comparing and explaining their results: Month October December November 32000 January March April February 32000 Month Actual Dan and October November December 35000 January February March April 27000 35000 36000 XXXXXXX PMS (2 months) PMP (60 y 40) t-1/t-2 SES (alpha of 0.6) 31000 4.-(20 pts) Determine the Utilization rate for each month (including April according to your dda projection analysis) according to the following table, explaining the result for each month. Production (Actual) Error Actual Demand 35000 32000 27000 35000 32000 36000 Reg Lineal UI 5.1.- Necessary production per month. 5.2.- Increasing number of collaborators and their justification. 5.-(10 pts) If the company intends to satisfy, from May (after the requested period) onwards, a demand of 40% more than the average of the last 7 months of registration indicates. Error The delivery must be made: a.- Excel, complete b.- Explanatory Word of each question. (names of members at the bottom of the page)
Expert Answer:

Related Book For 

Digital Systems Principles And Application
ISBN: 9780134220130
12th Edition
Authors: Ronald Tocci, Neal Widmer, Gregory Moss
Posted Date:
Students also viewed these general management questions
-
answer all questions as instructed below. attend all questions. 4 Computer Vision (a) Explain why such a tiny number of 2D Gabor wavelets as shown in this sequence are so efficient at representing...
-
In Exercises 7-9, find the indicated measure. The area of a circle is 380 square inches. Find the radius.
-
At December 31, 2019, Takeshi Group had a deferred tax liability of 680,000,000 resulting from future taxable amounts of 2,000,000,000 and an enacted tax rate of 34%. In May 2020, a new income tax...
-
The financial statements of M&S are presented in Appendix 5B or can be accessed at the books companion website, www.wiley.com Instructions Refer to M&Ss financial statements and the accompanying...
-
Perform the order-of \(-\epsilon^{2}\) approximation for the problem of diffusion with reaction in a catalyst of variable activity. Compare the flux with that obtained from the BVP4C solver in...
-
Suppose the herbicide manufacturer mentioned in the chapter can vertically integrate into just one of the downstream retail businesses, either home gardening or farming, but not both. Which one would...
-
Simplify. 74 y3 12n 3 21x y 3mn
-
Scenario: As of October 31, 2023, you are a member of your firm's audit team responsible for reviewing the financial statements of Karke Dikhaao Limited (Karke) for the fiscal year ending on...
-
The expected value of the motor home is $19,660 = (.02 x $3,000 + .98 x $20,000). Thus, fair insurance for the motor home would cost $340 = (.02 x $17,000), where $17,000 is the net loss from an...
-
Why does a positive NPV mean a project should be undertaken? Explain.
-
Describe an interest rate swap and give an example based on the following information. A company with a comparative advantage in the fixed-rate market desires a floating rate investment; and...
-
How can data-driven decision-making processes be structured to generate actionable insights that drive organizational growth and innovation?
-
Andrea Company purchases 30% of Sander Company's outstanding stock for $420,000. Andrea should record this investment at Multiple choice question. cost Sander's book value net realizable value...
-
Think back to meeting Justin Jones from Module 5. He was admitted after a motorcycle accident. He had surgery for fracture reduction on his legs and now has casts on both legs and one arm. For the...
-
Describe the systems approach. Where does the systems approach apply? Explain in a sentence what a manager does in the systems approach that he or she might not do otherwise.
-
Compare and contrast licensing and subcontracting.
-
Write the HDL code for a BCD-to-decimal decoder (the equivalent of a 7442).
-
The 74LS09 TTL IC is a quad two-input AND with open-collector outputs. Show how 74LS09s can be used to implement the operation x = A B C D E F g h I J K M.
-
Draw the gates necessary to decode all of the states of a MOD-16 counter using active-LOW outputs.
-
Baggai Enterprises has an ROA of 10 percent, retains 30 percent of earnings, and has an equity multiplier of 1.25. Mondale Enterprises also has an ROA of 10 percent, but it retains two-thirds of...
-
International Business Machines (NYSE: IBM), which currently pays a dividend of \($3.40\) per share, has been the subject of two other examples in this reading. In one example, an analyst estimated...
-
An analyst is preparing a forecast of dividends for Hoshino Distributors for the next five years. He uses a spreadsheet model with the following assumptions: Sales are $100 million in Year 1. They...

Study smarter with the SolutionInn App