

Question: The above Excel file provides a data set reporting the opinions of a sample of consumers regarding the signal strength, value for the dollar, and
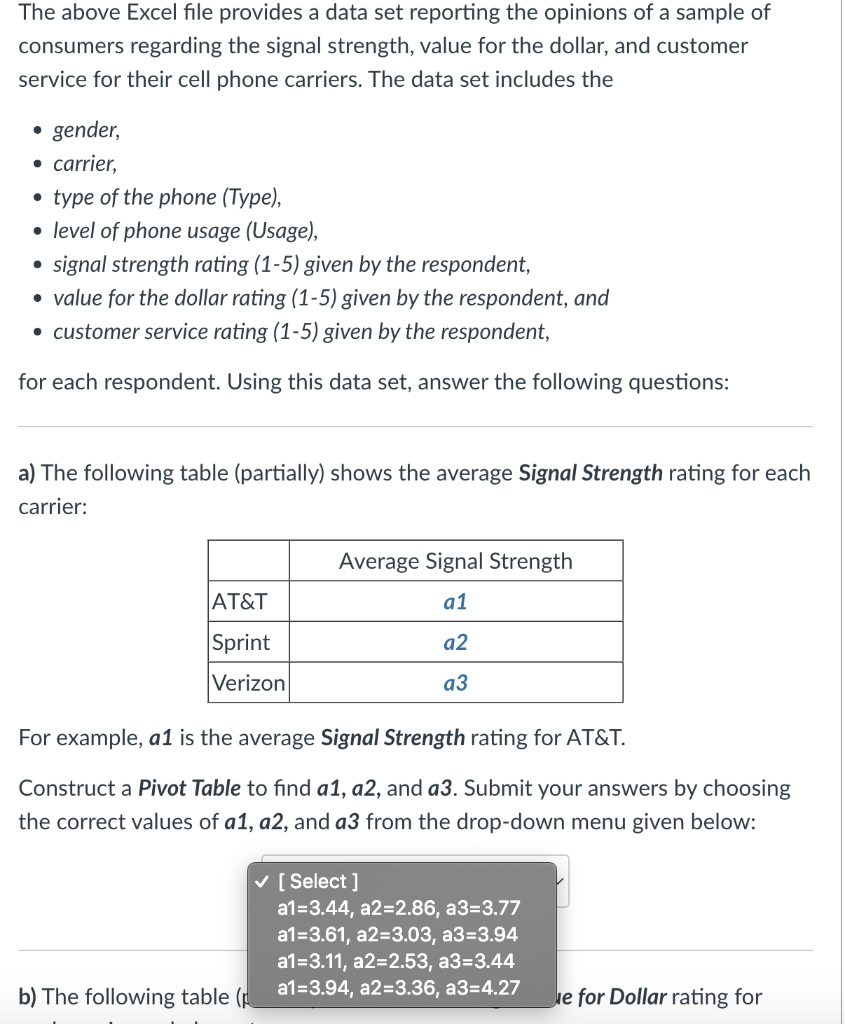
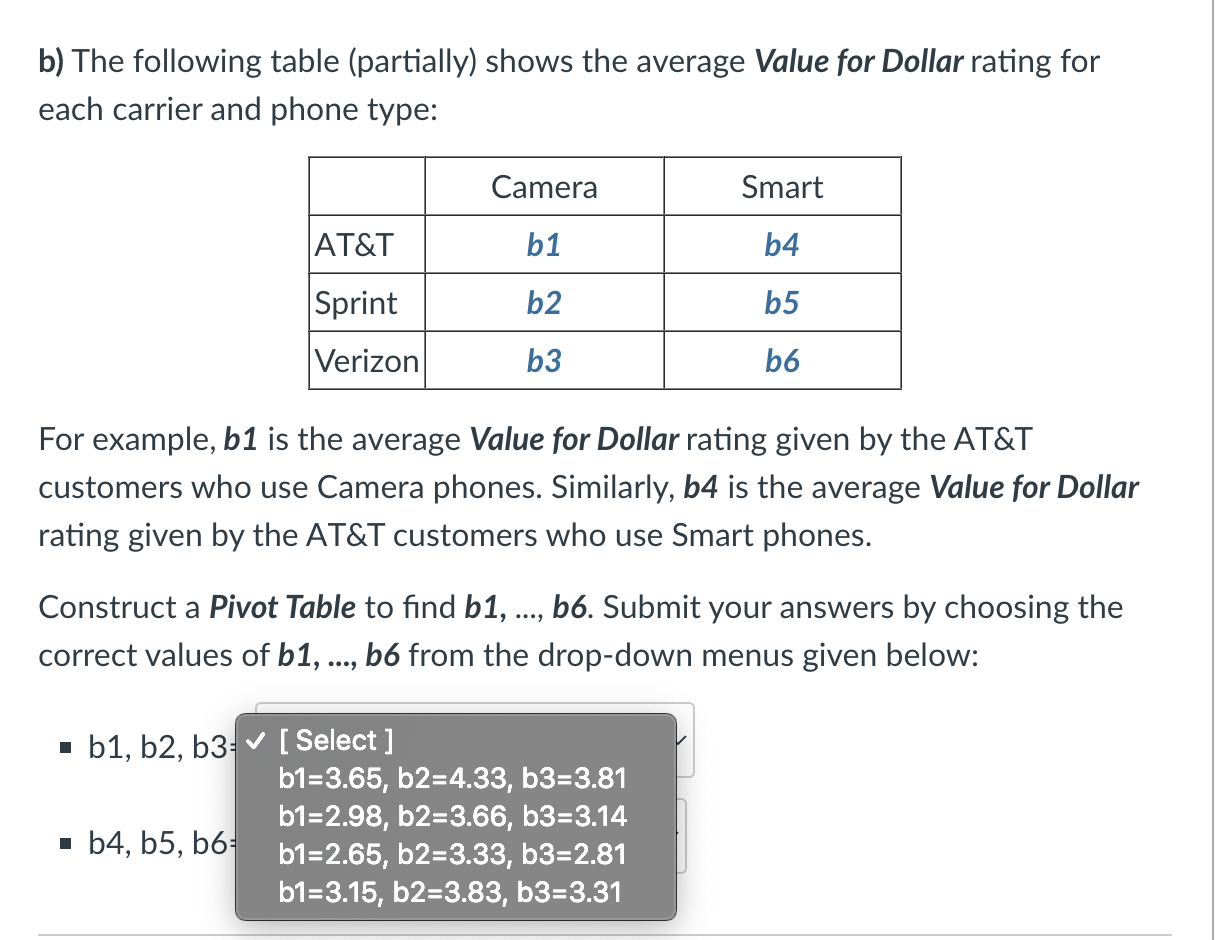
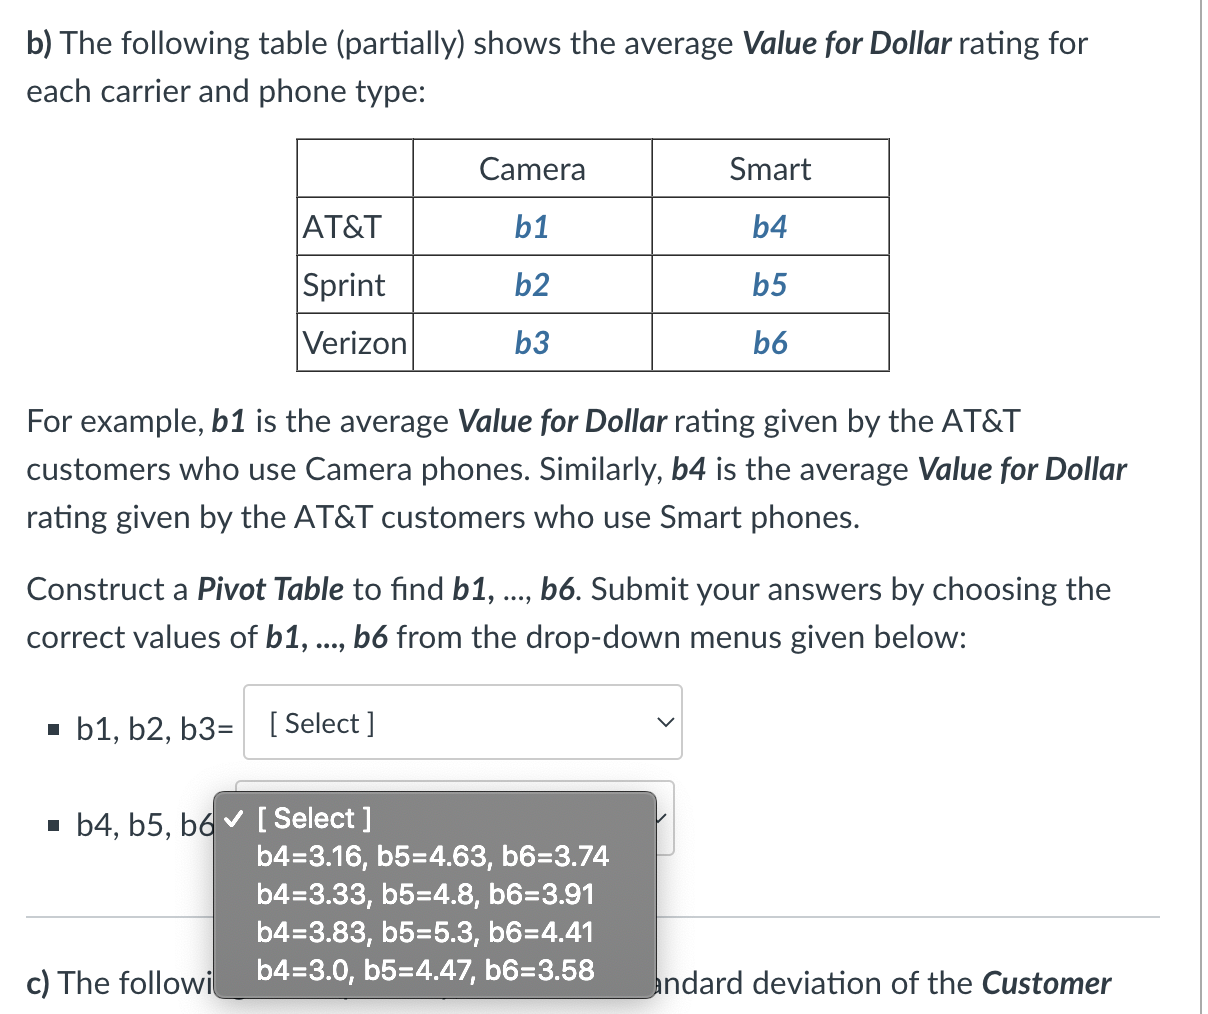

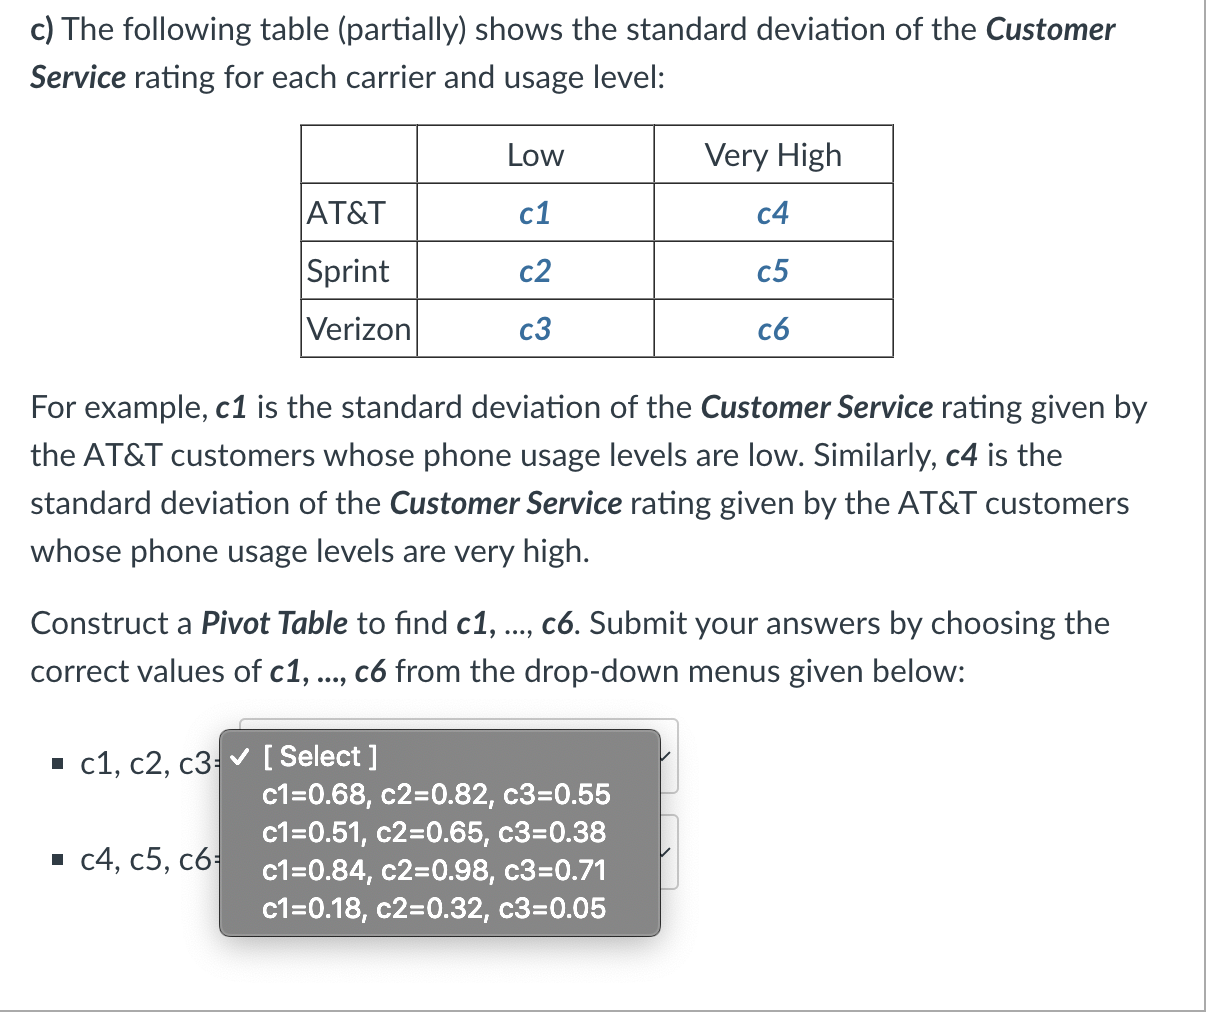
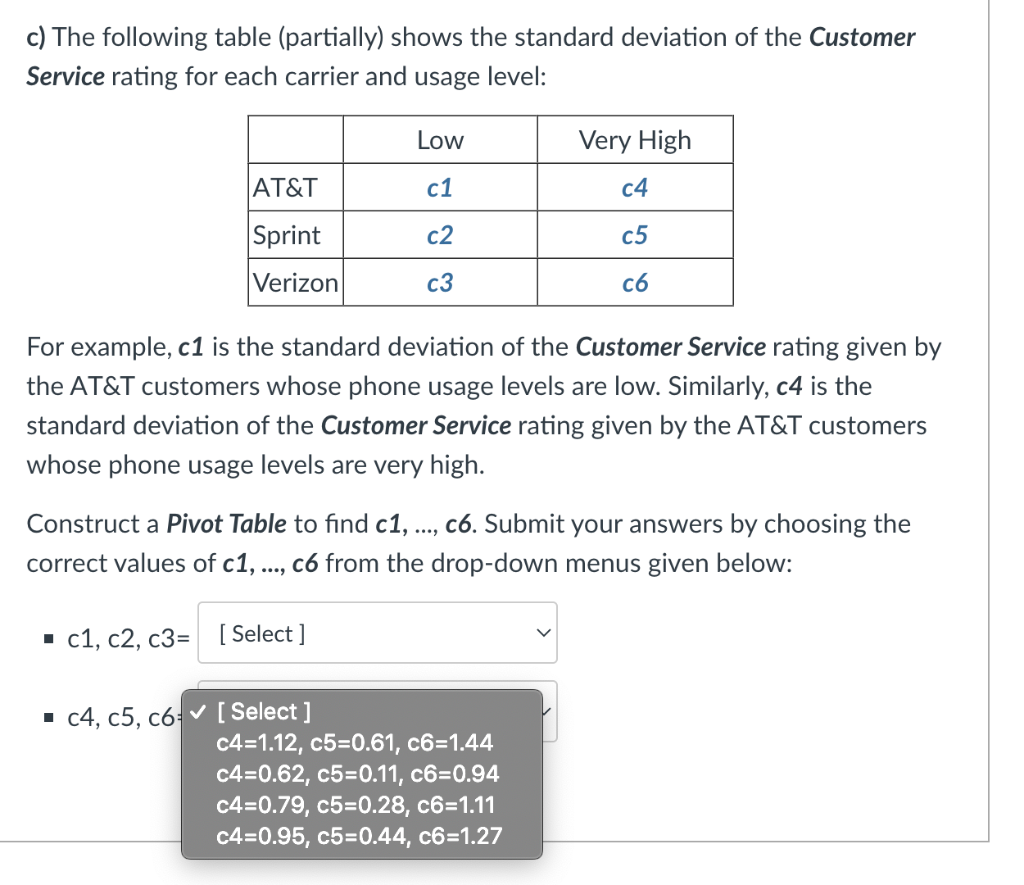
The above Excel file provides a data set reporting the opinions of a sample of consumers regarding the signal strength, value for the dollar, and customer service for their cell phone carriers. The data set includes the - gender, - carrier, - type of the phone (Type), - level of phone usage (Usage), - signal strength rating (1-5) given by the respondent, - value for the dollar rating (1-5) given by the respondent, and - customer service rating (1-5) given by the respondent, for each respondent. Using this data set, answer the following questions: a) The following table (partially) shows the average Signal Strength rating for each carrier: For example, a1 is the average Signal Strength rating for AT\&T. Construct a Pivot Table to find a1,a2, and a3. Submit your answers by choosing the correct values of a1,a2, and a3 from the drop-down menu given below: b) The following table ( ? for Dollar rating for b) The following table (partially) shows the average Value for Dollar rating for each carrier and phone type: For example, b1 is the average Value for Dollar rating given by the AT\&T customers who use Camera phones. Similarly, b4 is the average Value for Dollar rating given by the AT\&T customers who use Smart phones. Construct a Pivot Table to find b1,,b6. Submit your answers by choosing the correct values of b1,,b6 from the drop-down menus given below: b) The following table (partially) shows the average Value for Dollar rating for each carrier and phone type: For example, b1 is the average Value for Dollar rating given by the AT\&T customers who use Camera phones. Similarly, b4 is the average Value for Dollar rating given by the AT\&T customers who use Smart phones. Construct a Pivot Table to find b1,,b6. Submit your answers by choosing the correct values of b1,,b6 from the drop-down menus given below: - b1,b2,b3= - b4, b5, b6 c) The followi Idard deviation of the Customer c) The following table (partially) shows the standard deviation of the Customer Service rating for each carrier and usage level: For example, 1 is the standard deviation of the Customer Service rating given by the AT\&T customers whose phone usage levels are low. Similarly, c4 is the standard deviation of the Customer Service rating given by the AT\&T customers whose phone usage levels are very high. Construct a Pivot Table to find c1,,c6. Submit your answers by choosing the correct values of c1,,c6 from the drop-down menus given below: c) The following table (partially) shows the standard deviation of the Customer Service rating for each carrier and usage level: For example, 1 is the standard deviation of the Customer Service rating given by the AT\&T customers whose phone usage levels are low. Similarly, c4 is the standard deviation of the Customer Service rating given by the AT\&T customers whose phone usage levels are very high. Construct a Pivot Table to find c1,,c6. Submit your answers by choosing the correct values of c1,,c6 from the drop-down menus given below: c) The following table (partially) shows the standard deviation of the Customer Service rating for each carrier and usage level: For example, c1 is the standard deviation of the Customer Service rating given by the AT\&T customers whose phone usage levels are low. Similarly, c4 is the standard deviation of the Customer Service rating given by the AT\&T customers whose phone usage levels are very high. Construct a Pivot Table to find c1,,c6. Submit your answers by choosing the correct values of c1,,c6 from the drop-down menus given below: The above Excel file provides a data set reporting the opinions of a sample of consumers regarding the signal strength, value for the dollar, and customer service for their cell phone carriers. The data set includes the - gender, - carrier, - type of the phone (Type), - level of phone usage (Usage), - signal strength rating (1-5) given by the respondent, - value for the dollar rating (1-5) given by the respondent, and - customer service rating (1-5) given by the respondent, for each respondent. Using this data set, answer the following questions: a) The following table (partially) shows the average Signal Strength rating for each carrier: For example, a1 is the average Signal Strength rating for AT\&T. Construct a Pivot Table to find a1,a2, and a3. Submit your answers by choosing the correct values of a1,a2, and a3 from the drop-down menu given below: b) The following table ( ? for Dollar rating for b) The following table (partially) shows the average Value for Dollar rating for each carrier and phone type: For example, b1 is the average Value for Dollar rating given by the AT\&T customers who use Camera phones. Similarly, b4 is the average Value for Dollar rating given by the AT\&T customers who use Smart phones. Construct a Pivot Table to find b1,,b6. Submit your answers by choosing the correct values of b1,,b6 from the drop-down menus given below: b) The following table (partially) shows the average Value for Dollar rating for each carrier and phone type: For example, b1 is the average Value for Dollar rating given by the AT\&T customers who use Camera phones. Similarly, b4 is the average Value for Dollar rating given by the AT\&T customers who use Smart phones. Construct a Pivot Table to find b1,,b6. Submit your answers by choosing the correct values of b1,,b6 from the drop-down menus given below: - b1,b2,b3= - b4, b5, b6 c) The followi Idard deviation of the Customer c) The following table (partially) shows the standard deviation of the Customer Service rating for each carrier and usage level: For example, 1 is the standard deviation of the Customer Service rating given by the AT\&T customers whose phone usage levels are low. Similarly, c4 is the standard deviation of the Customer Service rating given by the AT\&T customers whose phone usage levels are very high. Construct a Pivot Table to find c1,,c6. Submit your answers by choosing the correct values of c1,,c6 from the drop-down menus given below: c) The following table (partially) shows the standard deviation of the Customer Service rating for each carrier and usage level: For example, 1 is the standard deviation of the Customer Service rating given by the AT\&T customers whose phone usage levels are low. Similarly, c4 is the standard deviation of the Customer Service rating given by the AT\&T customers whose phone usage levels are very high. Construct a Pivot Table to find c1,,c6. Submit your answers by choosing the correct values of c1,,c6 from the drop-down menus given below: c) The following table (partially) shows the standard deviation of the Customer Service rating for each carrier and usage level: For example, c1 is the standard deviation of the Customer Service rating given by the AT\&T customers whose phone usage levels are low. Similarly, c4 is the standard deviation of the Customer Service rating given by the AT\&T customers whose phone usage levels are very high. Construct a Pivot Table to find c1,,c6. Submit your answers by choosing the correct values of c1,,c6 from the drop-down menus given below
Step by Step Solution
There are 3 Steps involved in it

Get step-by-step solutions from verified subject matter experts