

Question: the above table is the answer i've done for the question a-g below : is it correct? and how do i draw the break-even chart
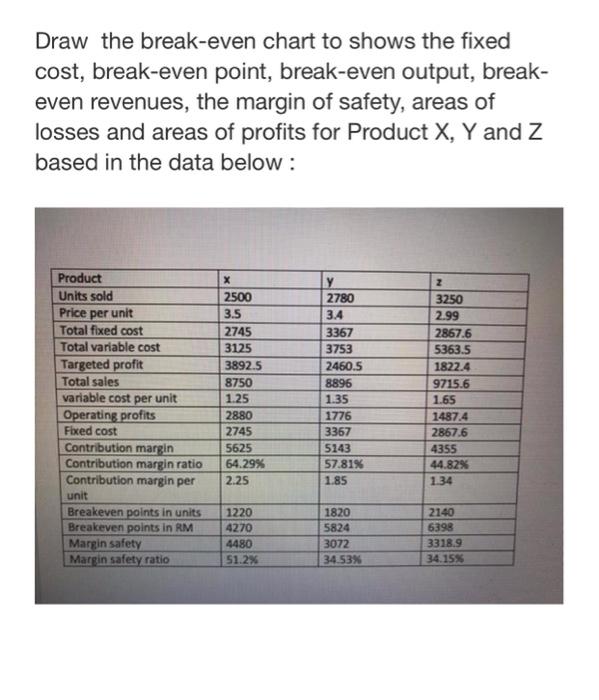
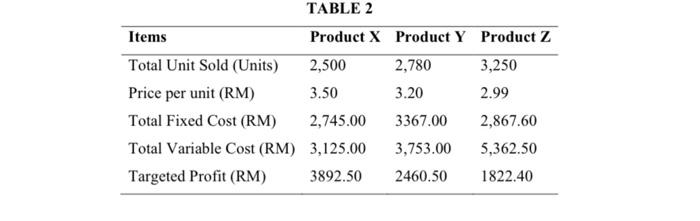
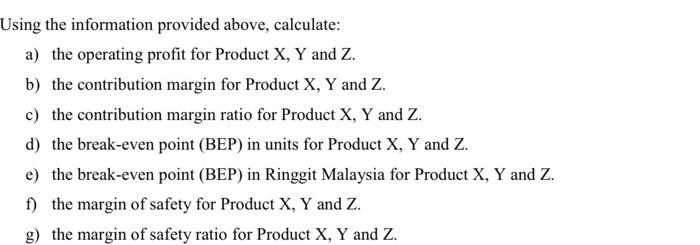
Draw the break-even chart to shows the fixed cost, break-even point, break-even output, break- even revenues, the margin of safety, areas of losses and areas of profits for Product X, Y and Z based in the data below: X 2 Product Units sold 2500 2780 3250 Price per unit 3.5 3.4 2.99 Total fixed cost 2745 3367 2867.6 Total variable cost 3125 3753 5363.5 Targeted profit 3892.5 2460.5 1822.4 Total sales 8750 8896 9715.6 variable cost per unit 1.25 1.35 1.65 2880 1776 1487.4 Operating profits Fixed cost 2745 3367 2867.6 Contribution margin 5625 5143 4355 Contribution margin ratio 64.29% 57.81% 44.82% 2.25 1.85 1.34 Contribution margin per unit Breakeven points in units 1220 1820 2140 Breakeven points in RM 4270 5824 6398 Margin safety 4480 3072 3318.9 Margin safety ratio 51.2% 34.53% 34.15% Items Total Unit Sold (Units) Price per unit (RM) Total Fixed Cost (RM) Total Variable Cost (RM) Targeted Profit (RM) TABLE 2 Product X Product Y Product Z 2,500 2,780 3,250 3.50 3.20 2.99 2,745.00 3367.00 2,867.60 3,125.00 3,753.00 5,362.50 3892.50 2460.50 1822.40 Using the information provided above, calculate: a) the operating profit for Product X, Y and Z. b) the contribution margin for Product X, Y and Z. c) the contribution margin ratio for Product X, Y and Z. d) the break-even point (BEP) in units for Product X, Y and Z. e) the break-even point (BEP) in Ringgit Malaysia for Product X, Y and Z. f) the margin of safety for Product X, Y and Z. g) the margin of safety ratio for Product X, Y and Z
Step by Step Solution
There are 3 Steps involved in it

Get step-by-step solutions from verified subject matter experts