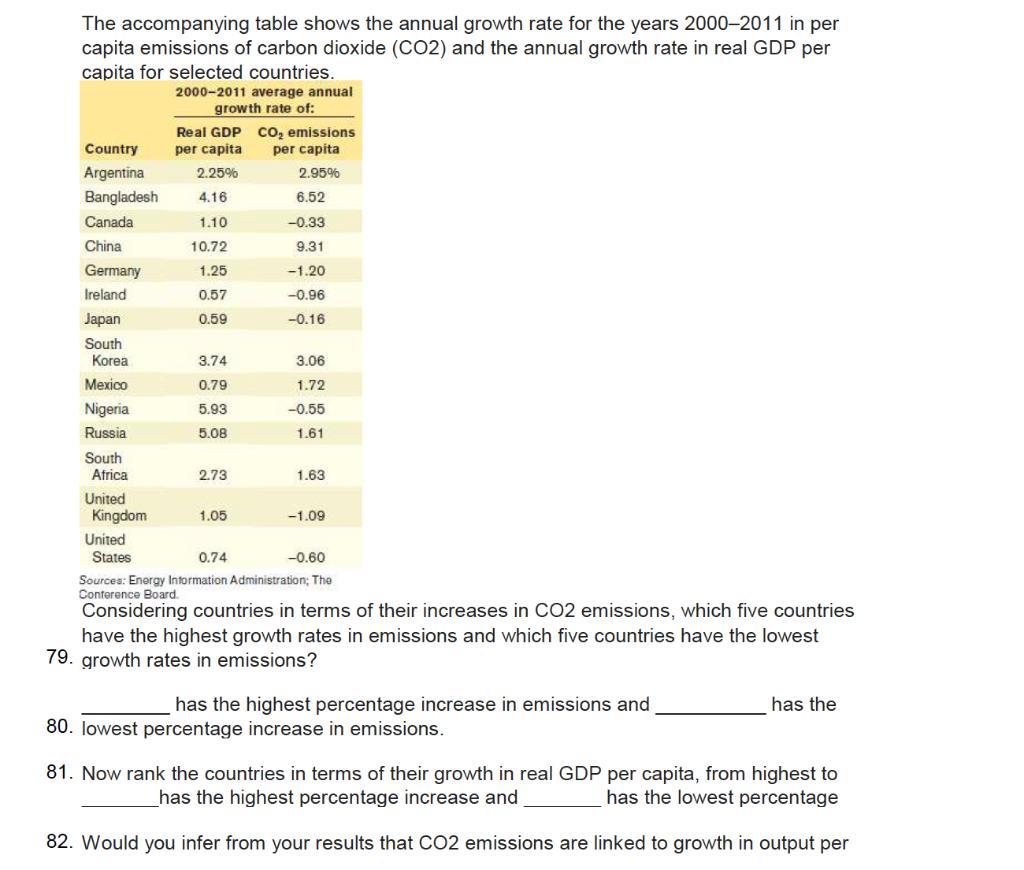
The accompanying table shows the annual growth rate for the years 2000-2011 in per capita emissions...
Fantastic news! We've Found the answer you've been seeking!
Question:
Transcribed Image Text:
The accompanying table shows the annual growth rate for the years 2000-2011 in per capita emissions of carbon dioxide (CO2) and the annual growth rate in real GDP per capita for selected countries. Real GDP Country per capita Argentina 2.25% Bangladesh 4.16 Canada 1.10 China 10.72 Germany 1.25 Ireland 0.57 0.59 Japan South Korea Mexico Nigeria Russia South Africa United Kingdom United 2000-2011 average annual growth rate of: States 3.74 0.79 5.93 5.08 2.73 1.05 CO₂ emissions per capita 2.95% 6.52 -0.33 9.31 -1.20 -0.96 -0.16 3.06 1.72 -0.55 1.61 1.63 -1.09 0.74 -0.60 Sources: Energy Information Administration; The Conference Board. Considering countries in terms of their increases in CO2 emissions, which five countries have the highest growth rates in emissions and which five countries have the lowest 79. growth rates in emissions? has the highest percentage increase in emissions and 80. lowest percentage increase in emissions. has the 81. Now rank the countries in terms of their growth in real GDP per capita, from highest to has the highest percentage increase and has the lowest percentage 82. Would you infer from your results that CO2 emissions are linked to growth in output per The accompanying table shows the annual growth rate for the years 2000-2011 in per capita emissions of carbon dioxide (CO2) and the annual growth rate in real GDP per capita for selected countries. Real GDP Country per capita Argentina 2.25% Bangladesh 4.16 Canada 1.10 China 10.72 Germany 1.25 Ireland 0.57 0.59 Japan South Korea Mexico Nigeria Russia South Africa United Kingdom United 2000-2011 average annual growth rate of: States 3.74 0.79 5.93 5.08 2.73 1.05 CO₂ emissions per capita 2.95% 6.52 -0.33 9.31 -1.20 -0.96 -0.16 3.06 1.72 -0.55 1.61 1.63 -1.09 0.74 -0.60 Sources: Energy Information Administration; The Conference Board. Considering countries in terms of their increases in CO2 emissions, which five countries have the highest growth rates in emissions and which five countries have the lowest 79. growth rates in emissions? has the highest percentage increase in emissions and 80. lowest percentage increase in emissions. has the 81. Now rank the countries in terms of their growth in real GDP per capita, from highest to has the highest percentage increase and has the lowest percentage 82. Would you infer from your results that CO2 emissions are linked to growth in output per
Expert Answer:
Answer rating: 100% (QA)
79 In terns of their CO2 emission the five highest countries ... View the full answer
Related Book For
Macroeconomics
ISBN: 978-1319120054
3rd Canadian edition
Authors: Paul Krugman, Robin Wells, Iris Au, Jack Parkinson
Posted Date:
Students also viewed these accounting questions
-
The accompanying table shows the annual growth rate for the years 20002014 in per capita emissions of carbon dioxide (CO 2 ) and the annual growth rate in real GDP per capita for selected countries....
-
The accompanying table shows a sample from poll results by The Globe and Mail Report on Business and Angus Reid, which compare CEO evaluations of the 25 top-performing firms over two years. For the...
-
The accompanying table shows proportions of computer salespeople classified according to marital status and whether they left their jobs or stayed over a period of 1 year. a. What is the probability...
-
Calculate the covariance of returns on the foreign index and the returns on the domestic index. An analyst produces the following joint probability function for a foreign index (FI) and a domestic...
-
Why would a company want to issue callable preferred stock?
-
On May 1, 2014, Friendly Company issued 2,000 $1,000 bonds at 102. Each bond was issued with one detachable stock warrant. Shortly after issuance, the bonds were selling at 98, but the fair value of...
-
The capital \(X_{t}\) of an insurance company, measured in millions of dollars, follows the generalized Wiener process \[d X_{t}=0.5 d t+2 d W_{t}\] where unit time is one year. The insurance company...
-
A new machine can be purchased today for $300,000. The annual revenue from the machine is calculated to be $67,000, and the equipment will last 10 years. Expect the maintenance and operating costs to...
-
What's the primary difference between STRIPS and Treasury receipts? Explain in your own words.
-
The following is Wolastoq Tours Limited's unadjusted trial balance at its year end, November 30, 2018. The company adjusts its accounts annually. Additional information: 1. The insurance policy has a...
-
8. On December 31, 2020, Sparkler Limited prepared a statement of earnings and balance sheet and failed to take into account four adjusting entries. The incorrect statement of earnings showed net...
-
Consider Anne from the previous question with the utility function U = X2Y2 and facing prices Px and Py and income I. a. Write out the Lagrangian function used for deriving the compensated demand...
-
give insights into how does fiscal policy being implemented during changes/shifts in the economy affect the financial outlook relative to annual deficits and the national debt?
-
What happens if the marginal revenue curve and the marginal cost curve do not intersect? Explain.
-
Pick a commodity market you know in the real world (can be goods or services. e.g. corn, potato chips, oil, retail, hospitals, etc.) and discuss to which market structure you think this market likely...
-
Discuss in detail 3 Causes and consequences and remedies of Heteroscedasticity b . Discuss in detail 3 Causes and consequences and remedies of Autocorrelation
-
Solve the below equation, x^(3)-7x^(2)-2x+8=0.
-
Would you use the adjacency matrix structure or the adjacency list structure in each of the following cases? Justify your choice. a. The graph has 10,000 vertices and 20,000 edges, and it is...
-
Using aggregate demand, short-run aggregate supply, and long-run aggregate supply curves, explain the process by which each of the following government policies will move the economy from one...
-
The waters off the North Atlantic coast were once teeming with fish. But due to overfishing by the commercial fishing industry, the stocks of fish became seriously depleted. In 1991, the...
-
Suppose that a major citys main thoroughfare, which is also an interstate highway, will be completely closed to traffic for two years, from January 2014 to December 2015, for reconstruction at a cost...
-
Why is it said that the PSNR principle has both a right and a duty side? Which one is most relevant with respect to international environmental law?
-
How many dimensions of the PSNR principle can you enumerate? To which one does UN Resolution 1803(1962) refer?
-
If there is a separate principle of precaution, do we need a principle of prevention?
Study smarter with the SolutionInn App