

Question: The analysis should be broken into small separate functions so that each aspect can be slowly built and edited. Make sure to consider all the
The analysis should be broken into small separate functions so that each aspect can be slowly built and edited. Make sure to consider all the outputs and inputs you would like for each function.
Specifically, you will be creating a program to help users analyze mechanical testing data. This data, available as a MAT file, has already been imported from the RAW files produced by the machine to save you time.
Submit your final working code as a collection of m files the file you want the user to run should be named 'RUNME.m and a user manual demonstration explaining both how to use your program, and how to interpret the example output.
Your code should include enough comments that it is clear what you are doing.
Your goal:
Create a software that can be used to easily analyze data from a mechanical testing system.
Background:
When creating tissue engineering products, it is common to test for the mechanical properties of each specimen.
While there are a fairly large number of mechanical properties that often need characterization, we will focus on those derived from a plot of stress and strain.
This is an example stressstrain curve from Wikimedia.
Let us first discuss how this plot is created, as this is step of the project.
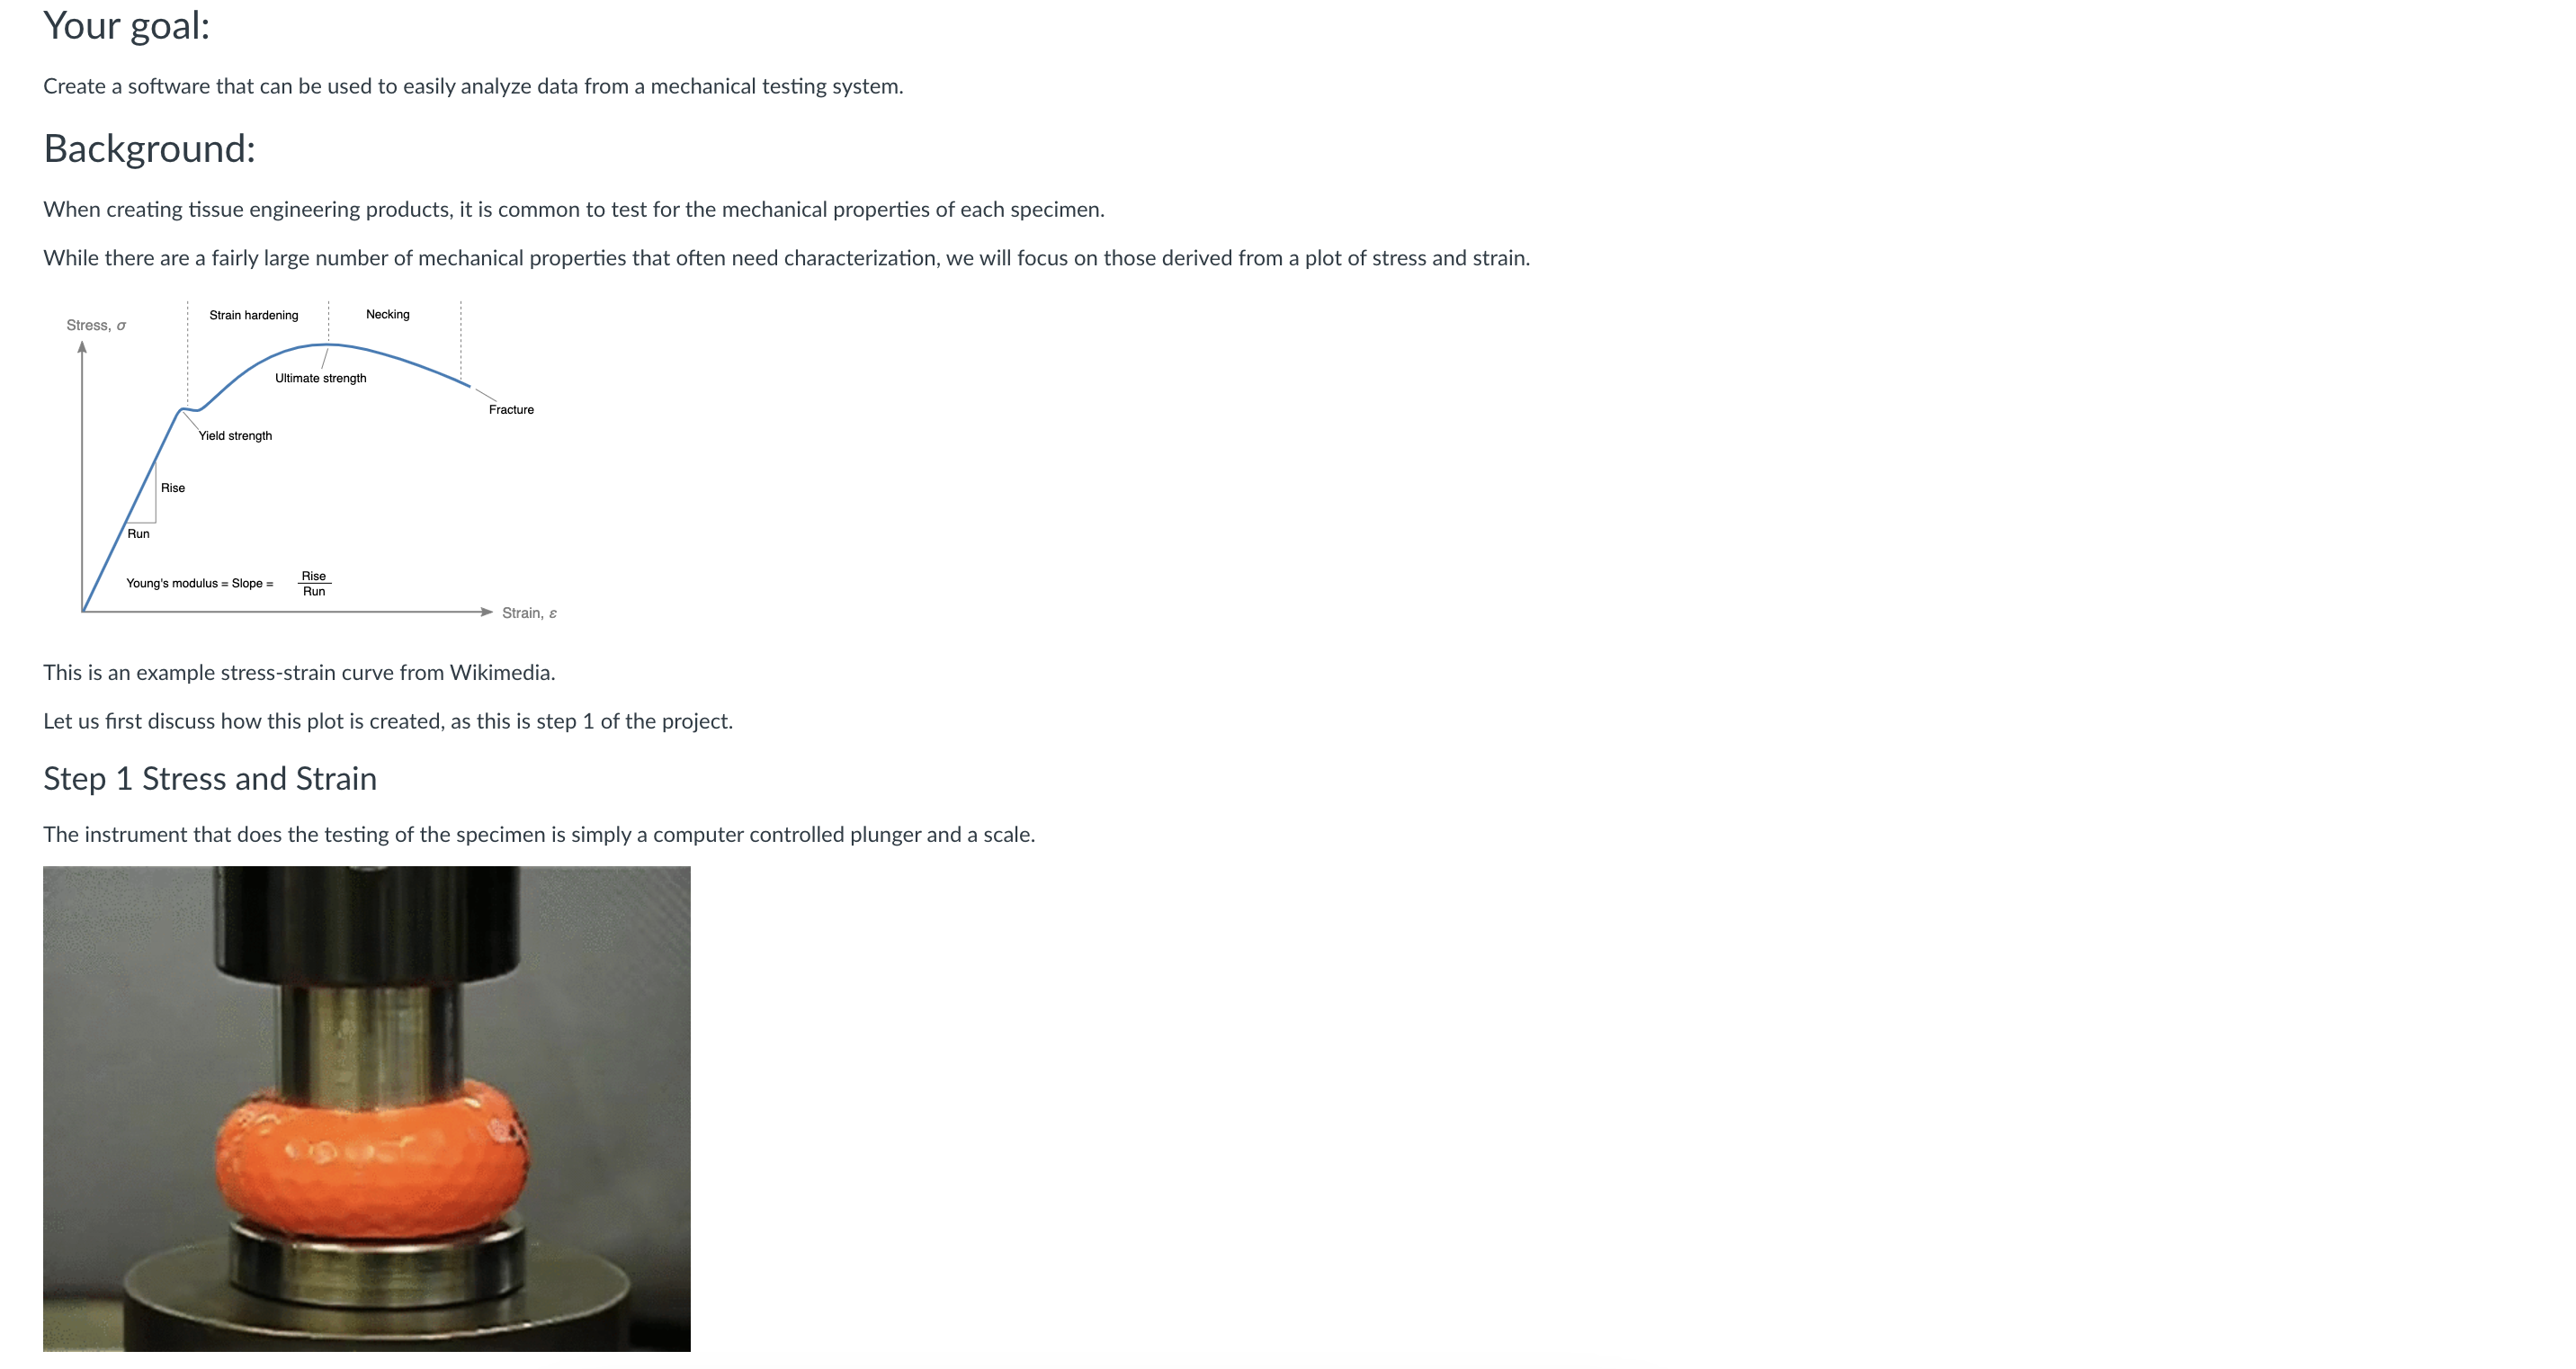
Step Stress and Strain
The instrument that does the testing of the specimen is simply a computer controlled plunger and a scale.
In this video the plunger called the 'crosshead' is moving down, and the pressure is being measured by a force gauge under the bottom plate.
The device is programmed to move the plunger over a certain distance and at a certain rate.
While the plunger presses into the sample, the computer records the position of the plunger, and also records the force registered.
These preliminary data can be used to immediately create displacementforce plots usually displacement is on the X axis, and force on the Y
However, for larger samples, these values can change bigger samples are harder to break
To reduce the effect of size, displacement is converted to strainDelta HH and force is converted to stress Force Area
Note that strain is calculated by the sample height in the direction of pressure, and the area is calculated as the cross section being pressed upon.
Consider the possibility that the user might have either cuboid or cylindrical samples.
Function #:
Given a list of numbers corresponding to displacement and force and the height and diameter of the sample cylindrical sample you must output a matrix of strain and stress. Example data here
For example, perhaps function stressstrainJAGconvertdisplacement force, height, diameter
Script #: This is a test script, and may not be needed, but will likely be useful on your way
Given a list of numbers corresponding to displacement and force and the height and diameter of the sample, use the function created above to create a stressstrain plot of the X
Step Offset as needed?
It is common to plot these graphs on top of each other, however, due to minor sample differences, the initial load can differ.
The samples can then be aligned by assigning a 'preload'. By shifting the graph so that all samples cross the y axis at the set preload, the graphs are easier aligned.
Function #:
Given a strainstress matrix as output above from function and a specified preload amount as your inputs, shift add an offset value to the strain data so that at strain stresspreload.
A simpler implementation might be to find what strain value correlates to a stress close enough to the preload, and subtract that strain value.
For example, perhaps function stressstrainJAGoffsetstressstrain, preload
Script #: This is a test script, and may not be needed, but will likely be useful on your way
Step Calculate the slope called the modulus
simply as the user to specify an upper limit and calculate for each graph the slope between strain and the user specified limit
Function #:
simply use all available datapoints. This will require the fit command and logical indexing to select the relevant values
For example, perhaps function modulusJAGmodulusstressstrain, upperlimit
This slope value, called the modulus, represents the stiffness of the sample, and it one of the most useful pieces of data that can be obtained.
Step Compare values and build a nice ui
Now that we have the ability to analyze the data, we still need to setup the final output and the user interface. This can involve more functions, or can be accomplished in a complex script.
Given a set of files to open you can ask the user how many, or require the select multiple files initially you need to walk the user through declaring the sample dimensions, and then plotting and calculating modulus.
The final output should include:
a graph of the overlapping curves in their entirety That is the data after conversion to stress and strain after function and
Step by Step Solution
There are 3 Steps involved in it
1 Expert Approved Answer
Step: 1 Unlock

Question Has Been Solved by an Expert!
Get step-by-step solutions from verified subject matter experts
Step: 2 Unlock
Step: 3 Unlock