

Question: The ANOVA summary table for an experiment with six groups, with five values in each group, is shown to the right. Complete parts (a)
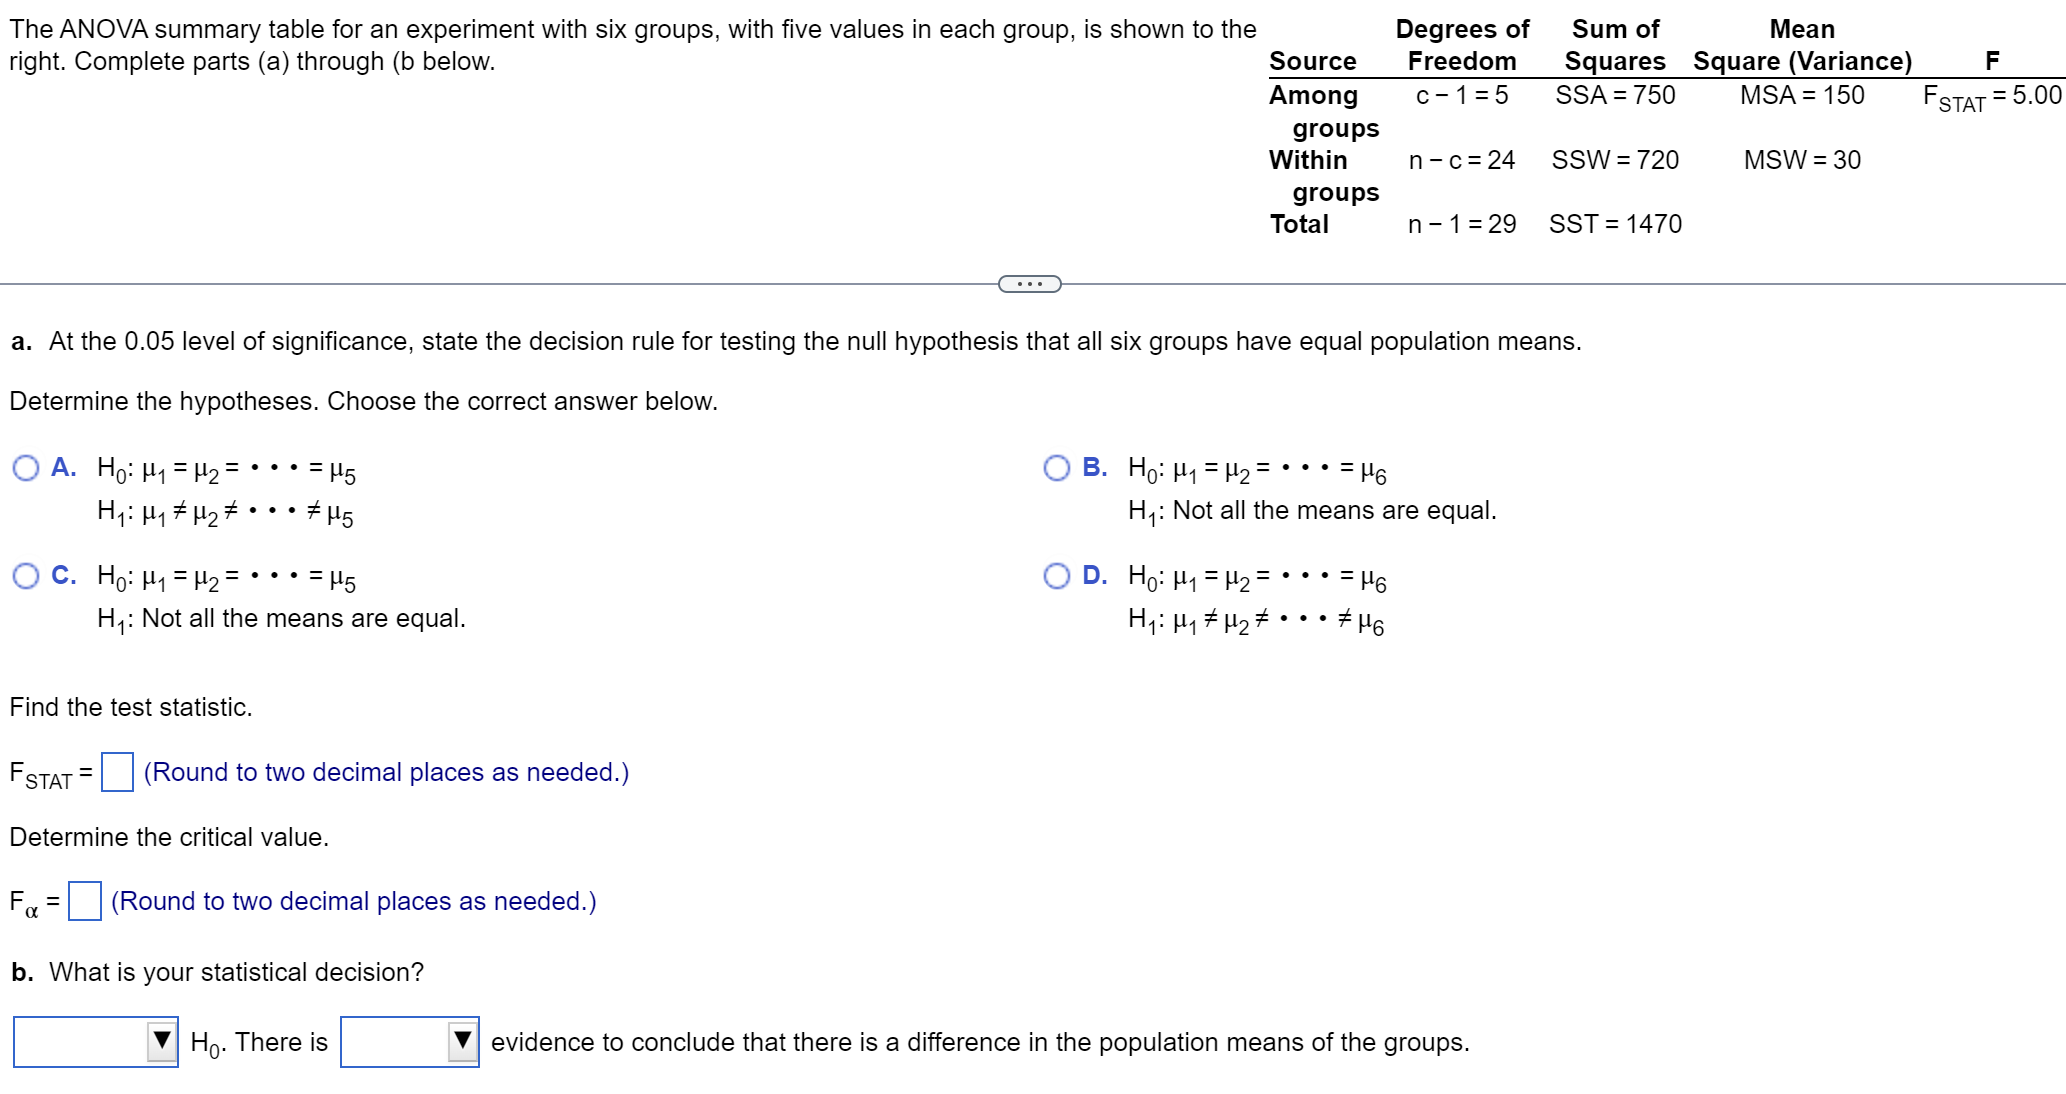
The ANOVA summary table for an experiment with six groups, with five values in each group, is shown to the right. Complete parts (a) through (b below. Source Among Degrees of Freedom C-1=5 Sum of Squares SSA = 750 Mean Square (Variance) MSA = 150 F FSTAT = 5.00 groups Within n-c=24 SSW = 720 MSW = 30 groups Total n-1=29 SST = 1470 a. At the 0.05 level of significance, state the decision rule for testing the null hypothesis that all six groups have equal population means. Determine the hypotheses. Choose the correct answer below. OA. Ho = = 5 H: # #45 OC. Ho H = = 5 H: Not all the means are equal. B. Ho: 12 = ... = = 6 H: Not all the means are equal. D. Ho: H =H2= H: # 2 * = 46 #46 Find the test statistic. FSTAT = (Round to two decimal places as needed.) Determine the critical value. Fa = (Round to two decimal places as needed.) b. What is your statistical decision? Ho. There is evidence to conclude that there is a difference in the population means of the groups.
Step by Step Solution
There are 3 Steps involved in it

Get step-by-step solutions from verified subject matter experts