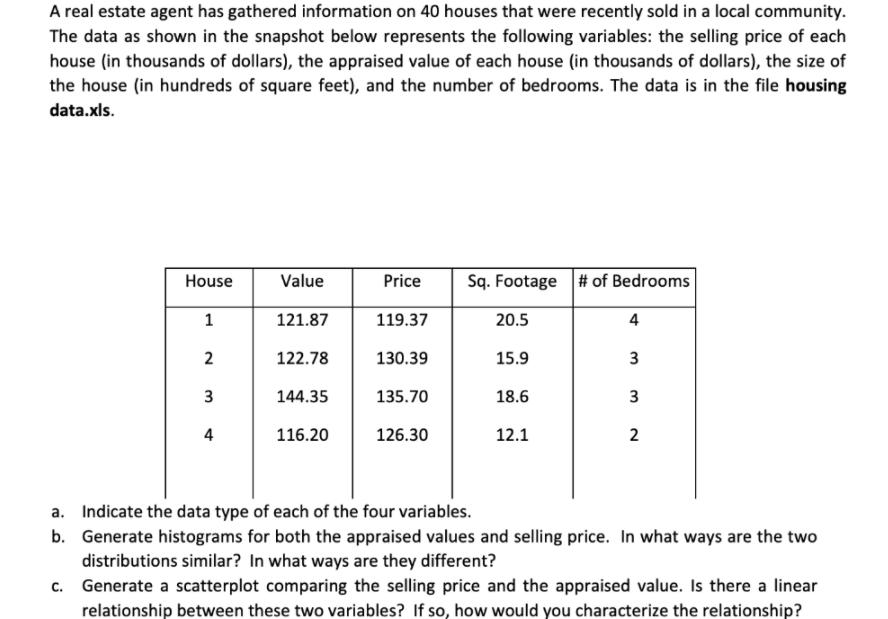
A real estate agent has gathered information on 40 houses that were recently sold in a...
Fantastic news! We've Found the answer you've been seeking!
Question:
Transcribed Image Text:
A real estate agent has gathered information on 40 houses that were recently sold in a local community. The data as shown in the snapshot below represents the following variables: the selling price of each house (in thousands of dollars), the appraised value of each house (in thousands of dollars), the size of the house (in hundreds of square feet), and the number of bedrooms. The data is in the file housing data.xls. House Value Price Sq. Footage # of Bedrooms 1 121.87 119.37 20.5 4 122.78 130.39 15.9 144.35 135.70 18.6 4 116.20 126.30 12.1 2 a. Indicate the data type of each of the four variables. b. Generate histograms for both the appraised values and selling price. In what ways are the two distributions similar? In what ways are they different? Generate a scatterplot comparing the selling price and the appraised value. Is there a linear relationship between these two variables? If so, how would you characterize the relationship? C. 3. 3. 2. 3. d. Generate two plots, the first examining the relationship between the size of the home and the selling price., and the second chart examining the relationship between the number of bedrooms in the home and its selling price. Which of these two variables (the size of the home or the number of bedrooms) seems to have the stronger relationship with the home's selling price? Justify your answer. A real estate agent has gathered information on 40 houses that were recently sold in a local community. The data as shown in the snapshot below represents the following variables: the selling price of each house (in thousands of dollars), the appraised value of each house (in thousands of dollars), the size of the house (in hundreds of square feet), and the number of bedrooms. The data is in the file housing data.xls. House Value Price Sq. Footage # of Bedrooms 1 121.87 119.37 20.5 4 122.78 130.39 15.9 144.35 135.70 18.6 4 116.20 126.30 12.1 2 a. Indicate the data type of each of the four variables. b. Generate histograms for both the appraised values and selling price. In what ways are the two distributions similar? In what ways are they different? Generate a scatterplot comparing the selling price and the appraised value. Is there a linear relationship between these two variables? If so, how would you characterize the relationship? C. 3. 3. 2. 3. d. Generate two plots, the first examining the relationship between the size of the home and the selling price., and the second chart examining the relationship between the number of bedrooms in the home and its selling price. Which of these two variables (the size of the home or the number of bedrooms) seems to have the stronger relationship with the home's selling price? Justify your answer.
Expert Answer:
Answer rating: 100% (QA)
a All four variables are quantitative variables To draw graphs we use R soft... View the full answer
Related Book For
Introductory Statistics Exploring the World Through Data
ISBN: 978-0321978271
2nd edition
Authors: Robert Gould, Colleen Ryan
Posted Date:
Students also viewed these accounting questions
-
The appraised value of a property has increased 233 1/3% since it was purchased by the present owner. The purchase price of the property was $120 000, its appraised value at that time. (a) How much...
-
The graphs show the house prices (in hundreds of thousands of dollars) in two fictitious towns. a. If you were describing the prices in Town A in terms of shape, center, and spread, without comparing...
-
The boxplots show the brain size (in hundreds of thousands of pixels) for 20 men and 20 women. Estimate the numerical values of the medians by using the boxplots. Do these men, or do these women,...
-
Cost-Volume-Profit (CVP) analysis can be used to determine the effect of changes in costs and volumes on a company's net profits. This project assignment assumes that you are newly hired as an...
-
Boron trifluoride, BF3, and ammonia, NH3, react to produce BF3NH3. A coordinate covalent bond is formed between the boron atom on BF3 and the nitrogen atom on NH3. Write the equation for this...
-
Top managers of Tranquility Inns are reviewing company performance for 2010. The income statement reports a 25% increase in net income over 2009. However, most of the increase resulted from an...
-
Write a Monte Carlo code for a system of \(N\) hard spheres of diameter \(D\) on a one-dimensional ring of length \(L\) with periodic boundary conditions. Calculate the pair correlation function and...
-
Kincaid Company sells flags with team logos. Kincaid has fixed costs of $583,200 per year plus variable costs of $4.80 per flag. Each flag sells for $12.00. Requirements 1. Use the income statement...
-
data in Range N 6 : Y 4 3 describes NFL quarterback ( QB ) statistics for the 2 0 1 3 season. Write different formulas for the following questions. Name Team G QBRat Comp Att Pct Yds Y / G Y / A TD...
-
The Royal Seas Company runs a three-night cruise to the Caribbean from Port Canaveral. The company wants to run TV ads promoting its cruises to high-income men, high-income women, and retirees. The...
-
The price of the PlayStation games increases. * O O a. (D) shifts to the right and (S) stays the same. The equilibrium price increases and the equilibrium quantity decreases. b. (D) stays the same...
-
It is said that the consequence of externality is the divergence between private and social costs or private and social benefits. Carefully explain how this situation occurs when the externality...
-
Carefully delineate the differences between public goods and common property resources. Why would it matter to know the difference between these two property in management and allocation of...
-
Discuss the differences between the two key criteria of supply chain performanceefficiency and responsiveness. Identify three measures for each criterion.
-
Export of hazardous electronic waste from the United States to a developing country such as Taiwan is reprehensible and immoral. Would this be considered an observation made on account of...
-
What are the pros and cons of overbooking as a revenue management strategy? Why is it necessary?
-
Which of the following statements is true? Perfect financial market integration implies that Relative PPP and uncovered interest rate parity give identical forecasts of the exchange rate. A...
-
Explain the buyers position in a typical negotiation for a business. Explain the sellers position. What tips would you offer a buyer about to begin negotiating the purchase of a business?
-
Bills Cell phone bills (rounded to the nearest dollar) for the most recent month for random samples of college men (M) and college women (F) were studied. Histograms for the numbers of dollars for...
-
The graph shows the average when a six-sided die is rolled repeatedly. For example, if the first two rolls resulted in a 6 and a 2, the average would be 4. If the next trial resulted in a 1, the new...
-
Are the career goals of young men changing? A Pew Poll asked young men about the importance they place on having a high-paying career or profession. Those men who said being successful in a...
-
Beginning in the 1920s, Russian physicist Pyotr Kapitza or Kapitsa (18941984, Nobel laureate in physics 1978) measured the Paschen-Back effect to an accuracy of 1 percent to 3 percent in various...
-
Consider transitions from a \({ }^{2} D\) state to a \(2 P\) state in the strong field PaschenBack regime. List all allowed transitions and show that there are only three different spectral lines.
-
What is the longest wavelength of the Paschen series spectrum? Would it be visible to the human eye?
Study smarter with the SolutionInn App