

Question: The appropriate test statistic and p-value for assessing whether there is evidence that bark thickness does aid in predicting height when used along with diameter
The appropriate test statistic and p-value for assessing whether there is evidence that bark thickness does aid in predicting height when used along with diameter are:
Group of answer choices
t = 4.645, p = .000201
F = 33.01, p = 9.499E-07
t = 2.188, p = .042087
t = 4.602, p = .000221
The interpretation of adjusted R2 is that:
Group of answer choices
76.2% of the variation in height is explained by variation in diameter and bark thickness.
76.2% of the variation in diameter and bark thickness is explained by variation in height.
78.6% of the variation in height is explained by variation in diameter and bark thickness.
78.6% of the variation in diameter and bark thickness is explained by variation in height.
The interpretation of the standard error of the estimate is that:
Group of answer choices
the (estimated) standard deviation in the height of redwood trees is 22.60 feet.
the (estimated) standard deviation in the height of redwood trees is 13.50 feet.
the (estimated) standard deviation in the height of redwood trees with the same diameter and bark thickness is 22.60 feet.
the (estimated) standard deviation in the height of redwood trees with the same diameter and bark thickness is 13.50 feet.
What height would you predict for a redwood tree with a diameter of 40 inches and a bark thickness of 2.3 inches?
203 feet
180 feet
164 feet
289 feet
Based on the sample regression coefficient of Diameter, we estimate that:
Group of answer choices
as the diameter increases by 1 inch, the height increases by 2.057 feet.
holding bark thickness constant, as the height increases by 1 foot, the diameter increases by 2.057 inches.
as the height increases by 1 foot, the diameter increases by 2.057 inches.
holding bark thickness constant, as the diameter increases by 1 inch, the height increases by 2.057 feet.
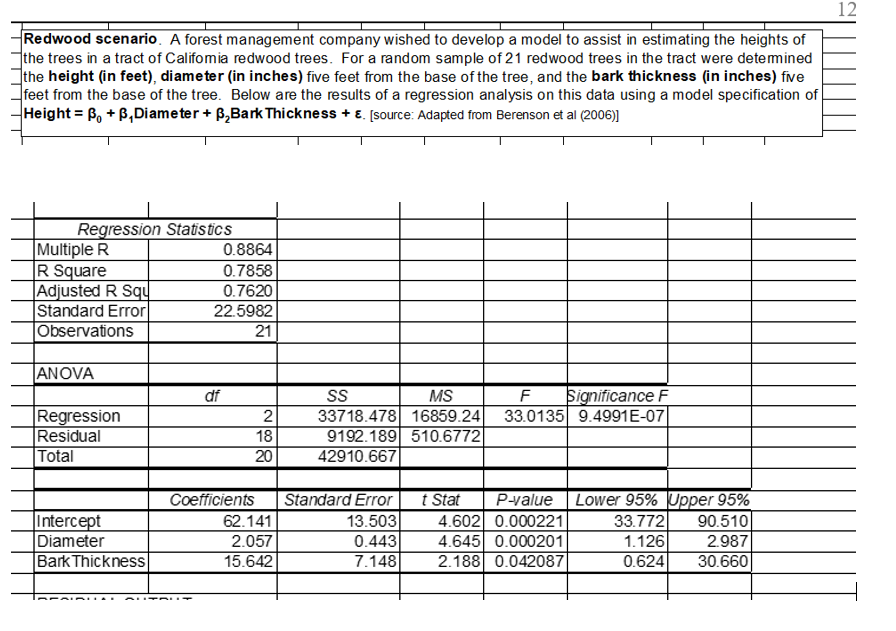
12 Redwood scenario. A forest management company wished to develop a model to assist in estimating the heights of the trees in a tract of Califomia redwood trees. For a random sample of 21 redwood trees in the tract were dete mined the height (in feet), diameter (in inches) five feet from the base of the tree, and the bark thickness (in inches) five feet from the base of the tree. Below are the results of a regression analysis on this data using a model specification of Height = B, +B,Diameter + B,Bark Thickness + E. [source: Adapted from Berenson et al (2006)] Regression Statistics Multiple R 0.8864 R Square 0.7858 Adjusted RSU 0.7620 Standard Error 22.5982 Observations 21 ANOVA df F Significance F 33.0135 9.4991E-07 Regression Residual Total 2 18 20 SS MS 33718.478 16859.24 9192.189 510.6772 42910.667 Intercept Diameter Bark Thickness Coefficients 62.141 2.057 15.642 Standard Error 13.503 0.443 7.148 t Stat P-value Lower 95% Upper 95% 4.602 0.000221 33.772 90.510 4.645 0.000201 1.126 2.987 2.188 0.042087 0.624 30.660
Step by Step Solution
There are 3 Steps involved in it

Get step-by-step solutions from verified subject matter experts