

The article A Statistical Analysis of the Notch Toughness of 9% Nickel Steels Obtained from Production Heats
Question:
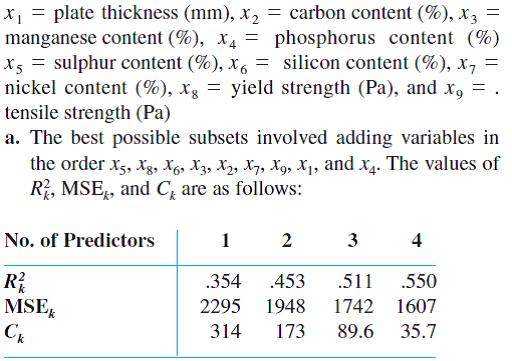
The article “A Statistical Analysis of the Notch Toughness of 9% Nickel Steels Obtained from Production Heats” (J. of Testing and Eval., 1987: 355–363) reports on the results of a multiple regression analysis relating Charpy v-notch toughness y (joules) to the following variables: x1 = plate thickness (mm), x2 = carbon content (%), x3 = manganese content (%), x4 = phosphorus content (%)x5 = sulphur content (%), x6 = silicon content (%), x7 = nickel content (%), yield strength (Pa), and x9 =. tensile strength (Pa).
a. The best possible subsets involved adding variables in the order x5, x8, x6, x3, x2, x7, x9, x1, and x4. The values of , MSEk, and Ck Rk2 MSEk, and Ck are as follows:
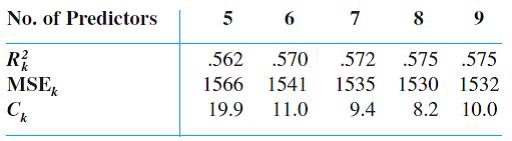
Which model would you recommend? Explain the rationale for your choice.
b. The authors also considered second-order models involving predictors and . Information on the best such models starting with the variables x2, x3, x5, x6, x7, and x8 is as follows (in going from the best four-predictor model to the best five-predictor model, x8 was deleted and both x2x6 and x7x8 were entered, and x8 was reentered at a later stage):
Which of these models would you recommend, and why?
Expert Answer:


Basic Business Statistics Concepts and Applications
ISBN: 978-0132168380
12th edition
Authors: Mark L. Berenson, David M. Levine, Timothy C. Krehbiel
