

Question: The attached Excel File contains information regarding the returns (%) on the S&9 500 Market Index and the returns (%) on Amazon Stocks over a
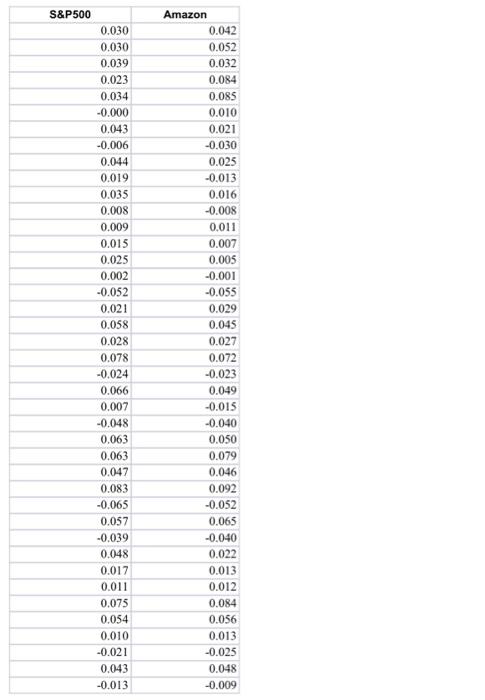
The attached Excel File contains information regarding the returns (%) on the S&9 500 Market Index and the returns (%) on Amazon Stocks over a period of time.
- Please run a regression with the returns on Amazon Stocks as the dependent variable and the returns on the S&P 500 as the independent variable and present your regression output.
- Are the intercept and slope coefficients statistically different from O at the 1%, 5%, and 10% levels?
- What does the R-square imply?
- Based on the regression results, what is the predicted return on Amazon Stock if the return on the S&P 500 is 10% (0.1)?
Step by Step Solution
There are 3 Steps involved in it
1 Expert Approved Answer
Step: 1 Unlock

Question Has Been Solved by an Expert!
Get step-by-step solutions from verified subject matter experts
Step: 2 Unlock
Step: 3 Unlock