

Question: the attached image is a chart based off the 2016 document; why Aus; benchmark report 2016. the document was prepared by the ATC. note that
the attached image is a chart based off the 2016 document; why Aus; benchmark report 2016. the document was prepared by the ATC.
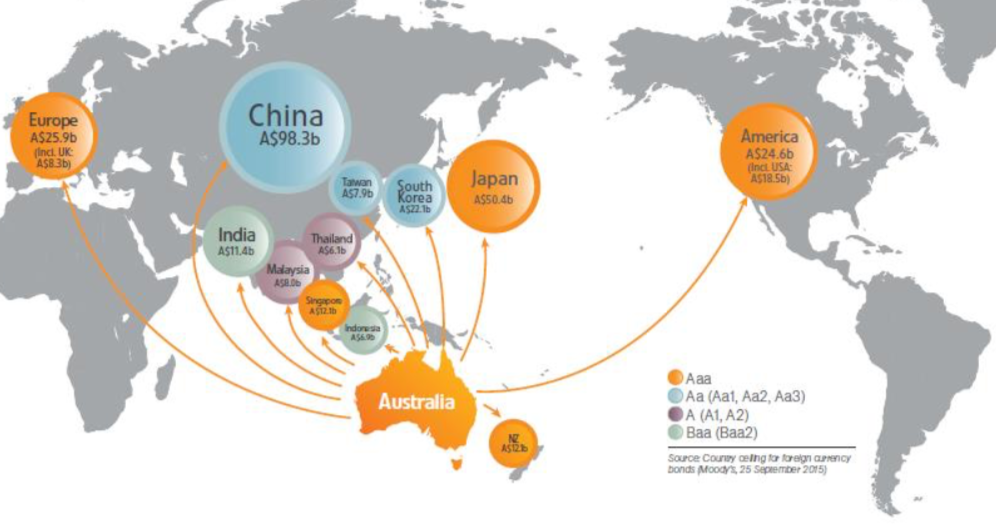
note that the chart description is as follows:
chart - australia, a partner for growth in asia. 10 of Australia's top 12 goods and services export markets were in the asian region as at 2014.
i) discuss the purpose of this chart and critically assess how well it meets said purpose.
ii) how would you change the graph if it were instead for a critical audience?
Step by Step Solution
There are 3 Steps involved in it
1 Expert Approved Answer
Step: 1 Unlock

Question Has Been Solved by an Expert!
Get step-by-step solutions from verified subject matter experts
Step: 2 Unlock
Step: 3 Unlock