

Question: The attached image is for data from the 50 states of the United States. The X-axis is the poverty rate in the state, and the
The attached image is for data from the 50 states of the United States. The X-axis is the poverty rate in the state, and the Y-axis is the violent crime rate in the state. The p-value is p=0.002 for a test of the null hypothesis that the slope of the line is zero, so we can reject the null hypothesis that the slope of the line is zero. EXPLAIN whether this information is sufficient to conclude (at the level of confidence typically used in political science) that a higher poverty rate in a state causes a higher violent crime rate.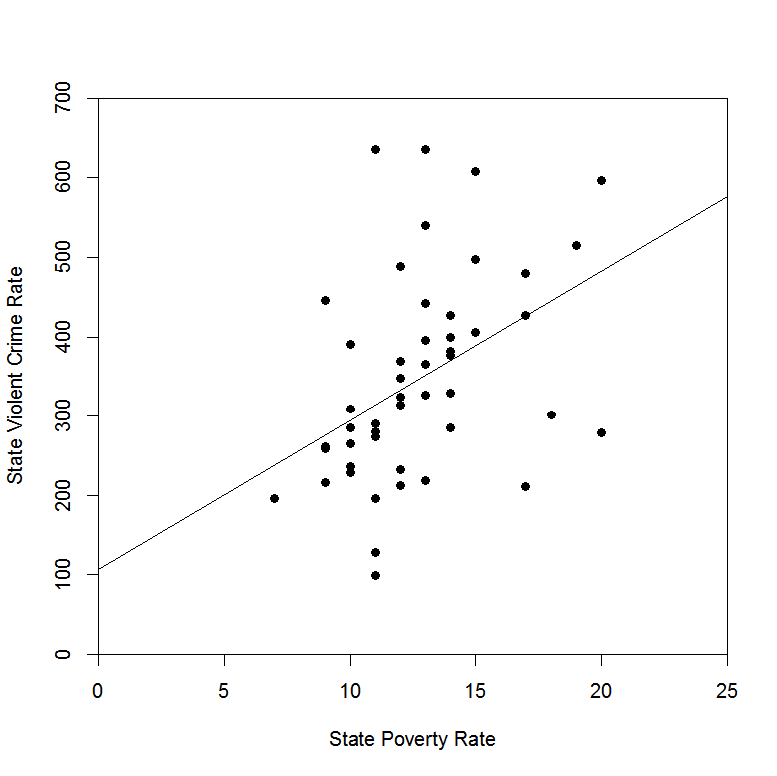
State Violent Crime Rate 0 100 200 300 400 500 600 700 5 10 15 20 State Poverty Rate 25 25
Step by Step Solution
There are 3 Steps involved in it
Solutions Step 1 we have the given regression equation y2099272x where x represents the poverty rate independent variable y represents the violent cri... View full answer

Get step-by-step solutions from verified subject matter experts