

Question: The below Financial Statement Ratio Analysis has been performed on a hospital. Requirement: Provide a comprehensive comments on the improvement and/or the deterioration of the
The below Financial Statement Ratio Analysis has been performed on a hospital.
Requirement: Provide a comprehensive comments on the improvement and/or the deterioration of the hospital's liquidity, profitability, solvency and efficiency through these 3 years.
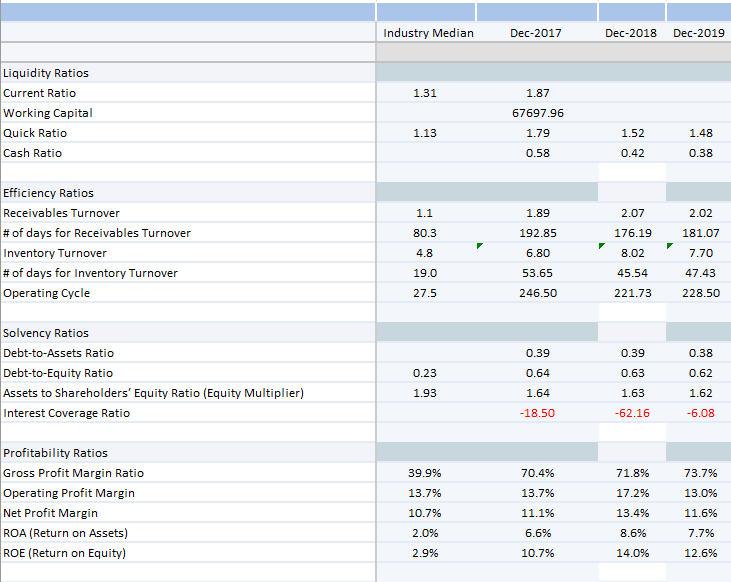
Industry Median Dec-2017 Dec-2018 Dec-2019 1.31 Liquidity Ratios Current Ratio Working Capital Quick Ratio Cash Ratio 1.87 67697.96 1.13 1.52 1.48 1.79 0.58 0.42 0.38 1.1 1.89 2.07 2.02 80.3 192.85 176.19 181.07 Efficiency Ratios Receivables Turnover # of days for Receivables Turnover Inventory Turnover # of days for Inventory Turnover Operating Cycle 4.8 6.80 8.02 7.70 19.0 53.65 45.54 47.43 27.5 246.50 221.73 228.50 0.39 0.39 0.38 Solvency Ratios Debt-to-Assets Ratio Debt-to-Equity Ratio Assets to Shareholders' Equity Ratio (Equity Multiplier) Interest Coverage Ratio 0.64 0.63 0.62 0.23 1.93 1.64 1.63 1.62 -18.50 -62.16 -6.08 39.9% 70.4% 71.8% 73.7% 13.7% 13.7% 17.2% 13.0% Profitability Ratios Gross Profit Margin Ratio Operating Profit Margin Net Profit Margin ROA (Return on Assets) ROE (Return on Equity) 10.7% 11.1% 13.4% 11.6% 2.0% 6.6% 8.6% 7.7% 2.9% 10.7% 14.0% 12.6%
Step by Step Solution
There are 3 Steps involved in it

Get step-by-step solutions from verified subject matter experts