

Question: The below plotted graph (5,1) and (1,5) is INCORRECT. I don't know what I'm doing wrong. The data below represent a demand schedule. Product Price
The below plotted graph (5,1) and (1,5) is INCORRECT. I don't know what I'm doing wrong.
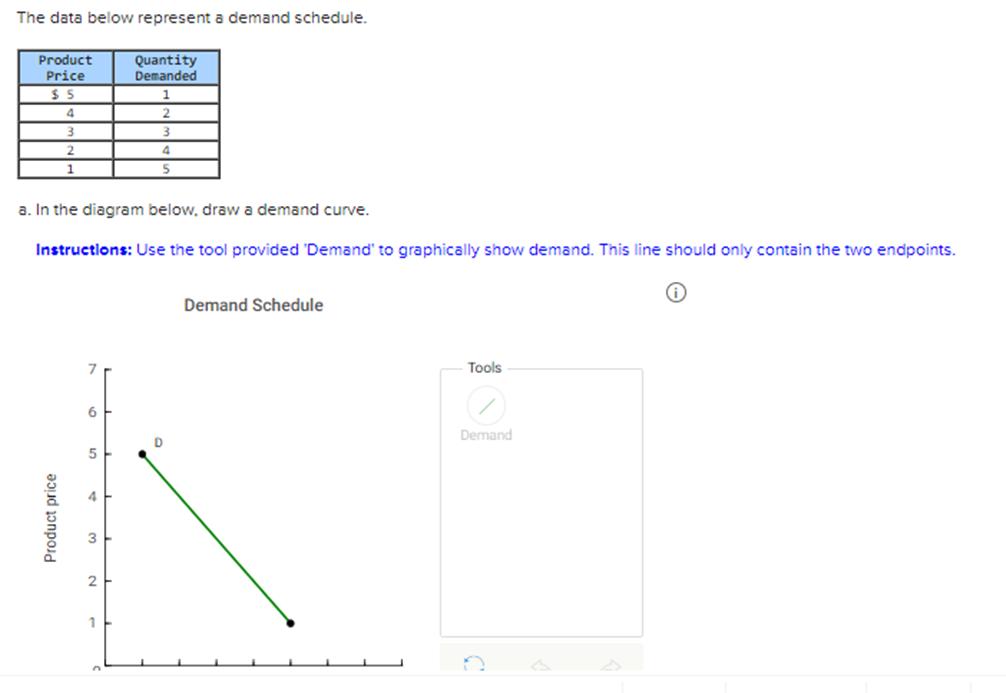
The data below represent a demand schedule. Product Price $5 4 3 2 1 Product price a. In the diagram below, draw a demand curve. Instructions: Use the tool provided 'Demand' to graphically show demand. This line should only contain the two endpoints. Quantity Demanded 1 2 3 4 5 5 D Demand Schedule Tools Demand
Step by Step Solution
3.39 Rating (152 Votes )
There are 3 Steps involved in it
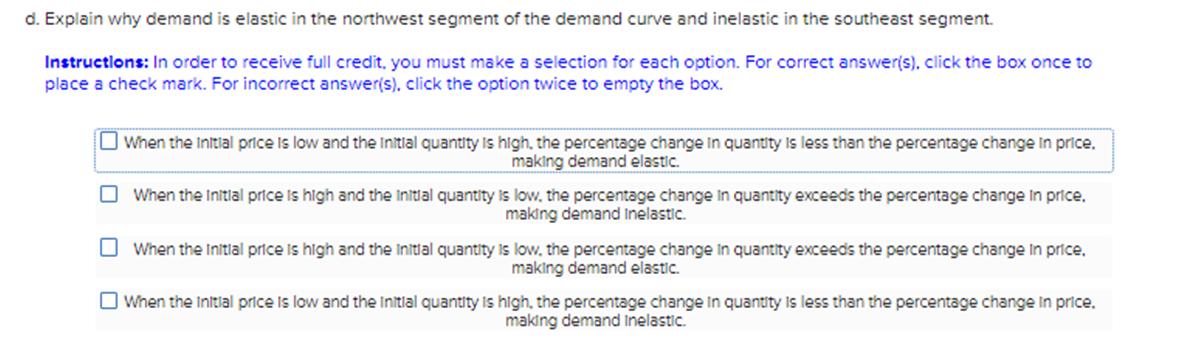
b Explain why demand is elastic in the northwest segment of the demand curve and inelastic in the so... View full answer

Get step-by-step solutions from verified subject matter experts