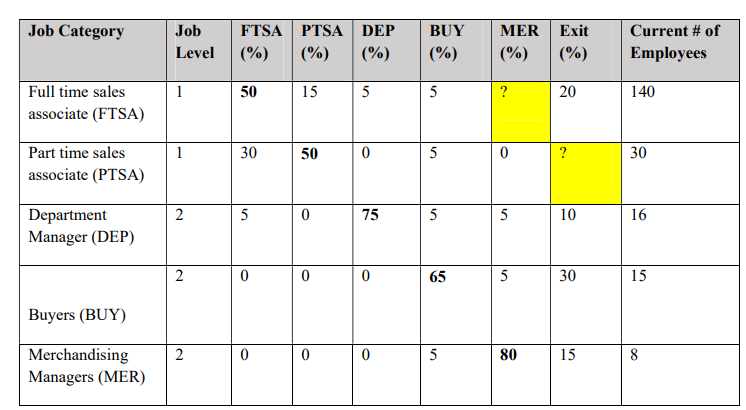
Question: The below table shows the transition probability matrix for a retail store. Assuming that the store managers want to maintain the current staffing levels for

The below table shows the transition probability matrix for a retail store. Assuming that the store managers want to maintain the current staffing levels for the next year, how many employees do they need to hire for each job category.

The below table shows the transition probability

Job Category Job Level FTSA (%) PTSA (%) DEP (%) BUY (%) MER (%) Exit (%) Current # of Employees 1 50 15 5 5 ? 20 140 Full time sales associate (FTSA) 1 30 50 0 5 5 0 30 Part time sales associate (PTSA) 2 5 5 0 75 5 5 10 16 Department Manager (DEP) 2 0 0 0 65 5 30 15 Buyers (BUY) 2 0 5 80 15 Merchandising Managers (MER) Job Category Job Level FTSA (%) PTSA (%) DEP (%) BUY (%) MER (%) Exit (%) Current # of Employees 1 50 15 5 5 ? 20 140 Full time sales associate (FTSA) 1 30 50 0 5 5 0 30 Part time sales associate (PTSA) 2 5 5 0 75 5 5 10 16 Department Manager (DEP) 2 0 0 0 65 5 30 15 Buyers (BUY) 2 0 5 80 15 Merchandising Managers (MER)

Step by Step Solution

There are 3 Steps involved in it

1 Expert Approved Answer
Step: 1 Unlock blur-text-image
Question Has Been Solved by an Expert!

Get step-by-step solutions from verified subject matter experts

Step: 2 Unlock
Step: 3 Unlock

Students Have Also Explored These Related General Management Questions!