Question: This first chart is a Transition Probability Matrix in which employees transition to other jobs in the company or leave the organization Transition Probability Matrix
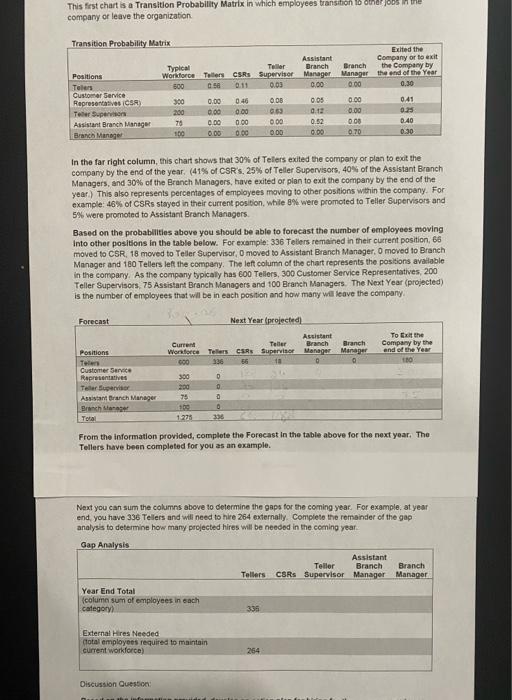
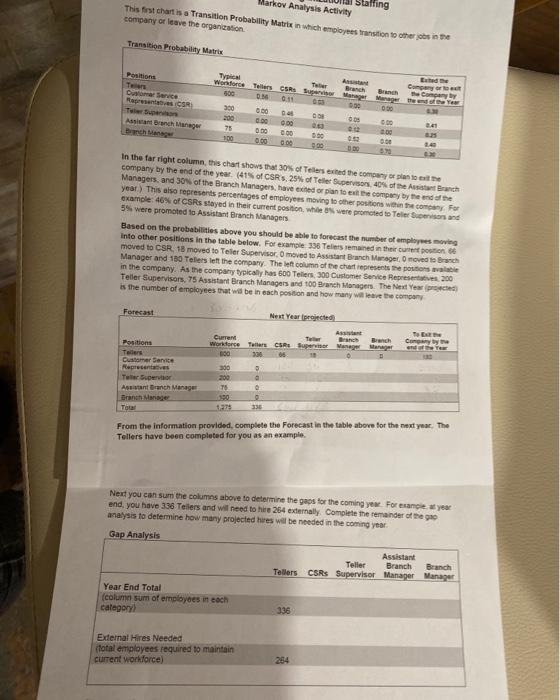
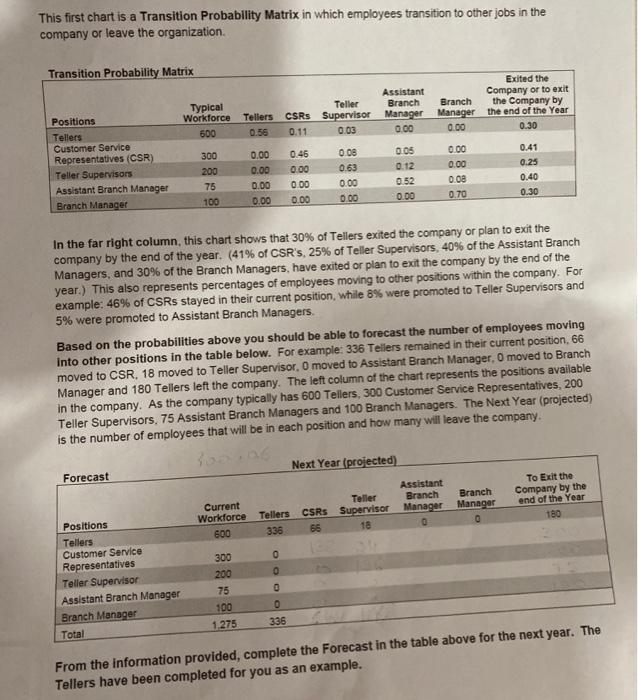
This first chart is a Transition Probability Matrix in which employees transition to other jobs in the company or leave the organization Transition Probability Matrix Edited the Assistant Company or to exit Typical Teller Branch Branch the Company by Positions Workforce Toilers CSR Supervisor Manager Manager the end of the Year Teles 500 0.58 0.00 0.00 0.30 Customer Service Representatives CSR 300 0.00 0.46 005 0.00 0.41 0.00 Tere person 0.00 0.63 0.13 0.00 0.25 Assistant Branch Manager 70 0.00 0.00 0.00 0.52 0.00 0.40 Branch Manager 100 00 0.00 070 0.30 In the far right column, this chart shows that 30% of Tellers exited the company or plan to exit the company by the end of the year. (41% of CSR'S 25% of Teller Supervisors, 40% of the Assistant Branch Managers, and 30% of the Branch Managers, have exited or plan to exit the company by the end of the year. This also represents percentages of employees moving to other positions within the company. For example: 46% of CSRs stayed in their current position, while 8% were promoted to Teller Supervisors and 5% were promoted to Assistant Branch Managers Based on the probabilities above you should be able to forecast the number of employees moving Into other positions in the table below. For example: 336 Tellers remained in their current position 66 moved to CSR, 18 moved to Teder Supervisor, O moved to Assistant Branch Manager. O moved to Branch Manager and 160 Tellers left the company. The left column of the chart represents the positions available in the company. As the company typically has 600 Tellers, 300 Customer Service Representatives, 200 Teller Supervisors, 75 Assistant Branch Managers and 100 Branch Managers. The Next Year (projected) is the number of employees that will be in each position and how many will leave the company Forecast Next Year (projected To Exif the Company by the end of the Year 100 Assistant Current Teller Branch Branch Workforce Tellers CSR Supervisor Manager Manager 600 336 Positions 0 300 200 Customer Service Representatives Te Buero Assistant Branch Manager Branch Lane Total 0 1221 3:36 From the information provided, complete the Forecast in the table above for the next year. The Tellers have been completed for you as an example. Next you can sum the columns above to determine the gaps for the coming year. For example at year end you have 336 Tellers and will need to hire 264 externally. Complete the remainder of the gap analysis to determine how many projected hires will be needed in the coming year Gap Analysis Assistant Teller Branch Branch Telters CSRs Supervisor Manager Manager Year End Total (colume sum of employees in each category 338 External Hires Needed dotal employees required to maintain current workforce) 264 Discussion Question Muh Markov Analysis Activity This first chart is a Transition Probability Matrix in which employees transition to other jobs in te company or leave the organization Staffing Transition Probability Matrix Ty Cum T Branch Comby Workforce CSR Supervisor Manager Mereteende 0.11 50 Customer Service 0.00 200 75 100 000 0.00 2.00 In the far right column, this chart shows that 30% of Tellers exted the company or plano company by the end of the year. (41of CSRS, 25% of Teller Supervison, 40of the Anch Managers and 30% of the Branch Managers, have exted or pian to eat the company by the end of the year) This also represents percentages of employees moving to other positions within the company. For example: 46% of CSRs stayed in their current position while were promoted to Televisors and 5% were promoted to Assistant Branch Managers Based on the probabilities above you should be able to forecast the number of employs moving into other positions in the table below. For example 336 Tellers remained in the current moved to CSR. 18 moved to Telier Supervisor o moved to Assistant Branch Manager moved to Branch Manager and 150 Telers left the company. The left column of the chart represents the posts in the company. As the company typically as 600 Tellers 300 Customer Senice Representatives 200 Teller Supervisors, 75 Assistant Branch Managers and 100 ranch Managers. The Next Year is the number of employees that we in each position and how many were the company Forecast Next Year ejected Branch Manager Comby de Positions Tallers Customer Service Representatives Turer Supervisor Asant branch Manager Current Workforce Tears CSR Super Manager 300 30 300 200 To 2 Total From the information provided, complete the Forecast in the table above for the next year. The Tollers have been completed for you as an example Next you can sum the columns above to determine the gaps for the coming ye Foresange you end, you have 336 Teilers and will need to hire 254 externally complete the remander of the pro analysis to determine how many projected hires will be needed in the coming year Gap Analysis Assistant Teller Branch Branch CSRS Supervisor Manager Manager Tellers Year End Total (column sum of employees in each category 336 External Hires Needed total employees required to maintain current workforce) 254 This first chart is a Transition Probability Matrix in which employees transition to other jobs in the company or leave the organization Transition Probability Matrix Typical Workforce 600 Assistant Teller Branch CSRs Supervisor Manager 0.03 0.00 Exited the Company or to exit Branch the Company by Manager the end of the Year 0.00 0.30 Tellers 0.56 0.00 Positions Tellers Customer Service Representatives (CSR) Teller Supervisors Assistant Branch Manager Branch Manager 300 200 75 100 0.00 0.00 0.00 0.00 0.46 0.00 0.00 0.00 0 08 0.63 0.00 0.00 0.05 0.12 0.52 0.00 0.00 0.00 0.70 0.41 0.25 0.40 0.30 In the far right column, this chart shows that 30% of Tellers exited the company or plan to exit the company by the end of the year. (41% of CSR's, 25% of Teller Supervisors, 40% of the Assistant Branch Managers, and 30% of the Branch Managers, have exited or plan to exit the company by the end of the year.) This also represents percentages of employees moving to other positions within the company. For example: 46% of CSRs stayed in their current position, while 8% were promoted to Teller Supervisors and 5% were promoted to Assistant Branch Managers. Based on the probabilities above you should be able to forecast the number of employees moving into other positions in the table below. For example: 336 Tellers remained in their current position, 66 moved to CSR. 18 moved to Teller Supervisor. O moved to Assistant Branch Manager. O moved to Branch Manager and 180 Tellers left the company. The left column of the chart represents the positions available in the company. As the company typically has 600 Tellers, 300 Customer Service Representatives, 200 Teller Supervisors, 75 Assistant Branch Managers and 100 Branch Managers. The Next Year (projected) is the number of employees that will be in each position and how many will leave the company. Next Year (projected) Forecast Assistant Branch Manager Branch Manager To Exit the Company by the end of the Year 180 Current Workforce 600 Teller Tellers CSRS Supervisor 336 66 18 Positions Tellers Customer Service Representatives Teller Supervisor Assistant Branch Manager Branch Manager Total 300 200 75 100 1 275 o o o o 8 From the information provided, complete the Forecast in the table above for the next year. The Tellers have been completed for you as an example. This first chart is a Transition Probability Matrix in which employees transition to other jobs in the company or leave the organization Transition Probability Matrix Edited the Assistant Company or to exit Typical Teller Branch Branch the Company by Positions Workforce Toilers CSR Supervisor Manager Manager the end of the Year Teles 500 0.58 0.00 0.00 0.30 Customer Service Representatives CSR 300 0.00 0.46 005 0.00 0.41 0.00 Tere person 0.00 0.63 0.13 0.00 0.25 Assistant Branch Manager 70 0.00 0.00 0.00 0.52 0.00 0.40 Branch Manager 100 00 0.00 070 0.30 In the far right column, this chart shows that 30% of Tellers exited the company or plan to exit the company by the end of the year. (41% of CSR'S 25% of Teller Supervisors, 40% of the Assistant Branch Managers, and 30% of the Branch Managers, have exited or plan to exit the company by the end of the year. This also represents percentages of employees moving to other positions within the company. For example: 46% of CSRs stayed in their current position, while 8% were promoted to Teller Supervisors and 5% were promoted to Assistant Branch Managers Based on the probabilities above you should be able to forecast the number of employees moving Into other positions in the table below. For example: 336 Tellers remained in their current position 66 moved to CSR, 18 moved to Teder Supervisor, O moved to Assistant Branch Manager. O moved to Branch Manager and 160 Tellers left the company. The left column of the chart represents the positions available in the company. As the company typically has 600 Tellers, 300 Customer Service Representatives, 200 Teller Supervisors, 75 Assistant Branch Managers and 100 Branch Managers. The Next Year (projected) is the number of employees that will be in each position and how many will leave the company Forecast Next Year (projected To Exif the Company by the end of the Year 100 Assistant Current Teller Branch Branch Workforce Tellers CSR Supervisor Manager Manager 600 336 Positions 0 300 200 Customer Service Representatives Te Buero Assistant Branch Manager Branch Lane Total 0 1221 3:36 From the information provided, complete the Forecast in the table above for the next year. The Tellers have been completed for you as an example. Next you can sum the columns above to determine the gaps for the coming year. For example at year end you have 336 Tellers and will need to hire 264 externally. Complete the remainder of the gap analysis to determine how many projected hires will be needed in the coming year Gap Analysis Assistant Teller Branch Branch Telters CSRs Supervisor Manager Manager Year End Total (colume sum of employees in each category 338 External Hires Needed dotal employees required to maintain current workforce) 264 Discussion Question Muh Markov Analysis Activity This first chart is a Transition Probability Matrix in which employees transition to other jobs in te company or leave the organization Staffing Transition Probability Matrix Ty Cum T Branch Comby Workforce CSR Supervisor Manager Mereteende 0.11 50 Customer Service 0.00 200 75 100 000 0.00 2.00 In the far right column, this chart shows that 30% of Tellers exted the company or plano company by the end of the year. (41of CSRS, 25% of Teller Supervison, 40of the Anch Managers and 30% of the Branch Managers, have exted or pian to eat the company by the end of the year) This also represents percentages of employees moving to other positions within the company. For example: 46% of CSRs stayed in their current position while were promoted to Televisors and 5% were promoted to Assistant Branch Managers Based on the probabilities above you should be able to forecast the number of employs moving into other positions in the table below. For example 336 Tellers remained in the current moved to CSR. 18 moved to Telier Supervisor o moved to Assistant Branch Manager moved to Branch Manager and 150 Telers left the company. The left column of the chart represents the posts in the company. As the company typically as 600 Tellers 300 Customer Senice Representatives 200 Teller Supervisors, 75 Assistant Branch Managers and 100 ranch Managers. The Next Year is the number of employees that we in each position and how many were the company Forecast Next Year ejected Branch Manager Comby de Positions Tallers Customer Service Representatives Turer Supervisor Asant branch Manager Current Workforce Tears CSR Super Manager 300 30 300 200 To 2 Total From the information provided, complete the Forecast in the table above for the next year. The Tollers have been completed for you as an example Next you can sum the columns above to determine the gaps for the coming ye Foresange you end, you have 336 Teilers and will need to hire 254 externally complete the remander of the pro analysis to determine how many projected hires will be needed in the coming year Gap Analysis Assistant Teller Branch Branch CSRS Supervisor Manager Manager Tellers Year End Total (column sum of employees in each category 336 External Hires Needed total employees required to maintain current workforce) 254 This first chart is a Transition Probability Matrix in which employees transition to other jobs in the company or leave the organization Transition Probability Matrix Typical Workforce 600 Assistant Teller Branch CSRs Supervisor Manager 0.03 0.00 Exited the Company or to exit Branch the Company by Manager the end of the Year 0.00 0.30 Tellers 0.56 0.00 Positions Tellers Customer Service Representatives (CSR) Teller Supervisors Assistant Branch Manager Branch Manager 300 200 75 100 0.00 0.00 0.00 0.00 0.46 0.00 0.00 0.00 0 08 0.63 0.00 0.00 0.05 0.12 0.52 0.00 0.00 0.00 0.70 0.41 0.25 0.40 0.30 In the far right column, this chart shows that 30% of Tellers exited the company or plan to exit the company by the end of the year. (41% of CSR's, 25% of Teller Supervisors, 40% of the Assistant Branch Managers, and 30% of the Branch Managers, have exited or plan to exit the company by the end of the year.) This also represents percentages of employees moving to other positions within the company. For example: 46% of CSRs stayed in their current position, while 8% were promoted to Teller Supervisors and 5% were promoted to Assistant Branch Managers. Based on the probabilities above you should be able to forecast the number of employees moving into other positions in the table below. For example: 336 Tellers remained in their current position, 66 moved to CSR. 18 moved to Teller Supervisor. O moved to Assistant Branch Manager. O moved to Branch Manager and 180 Tellers left the company. The left column of the chart represents the positions available in the company. As the company typically has 600 Tellers, 300 Customer Service Representatives, 200 Teller Supervisors, 75 Assistant Branch Managers and 100 Branch Managers. The Next Year (projected) is the number of employees that will be in each position and how many will leave the company. Next Year (projected) Forecast Assistant Branch Manager Branch Manager To Exit the Company by the end of the Year 180 Current Workforce 600 Teller Tellers CSRS Supervisor 336 66 18 Positions Tellers Customer Service Representatives Teller Supervisor Assistant Branch Manager Branch Manager Total 300 200 75 100 1 275 o o o o 8 From the information provided, complete the Forecast in the table above for the next year. The Tellers have been completed for you as an example