

Question: The below table shows your stock positions at the beginning of the year, the dividends that each stock paid during the year, and the stock
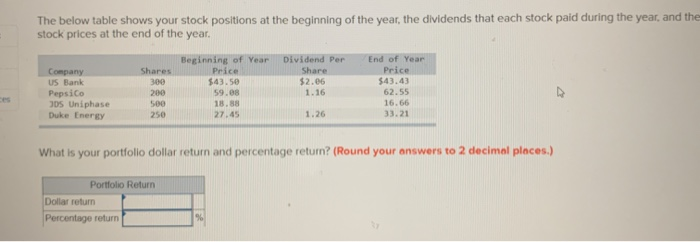
The below table shows your stock positions at the beginning of the year, the dividends that each stock paid during the year, and the stock prices at the end of the year. Shares Beginning of Year Price $43.50 50.08 18. Dividend Per Share $2.06 Company US Bank Pepsico 305 Uniphase Duke Energy End of Year Price $43.43 62.55 16.66 33.21 200 What is your portfolio dollar return and percentage return? (Round your answers to 2 decimal places.) Portfolio Return Dollar retum Percentage return
Step by Step Solution
There are 3 Steps involved in it
1 Expert Approved Answer
Step: 1 Unlock

Question Has Been Solved by an Expert!
Get step-by-step solutions from verified subject matter experts
Step: 2 Unlock
Step: 3 Unlock