

Question: The below three graphs show probability density functions (PDF) of three different random variables Red, Green and Blue. Let P1 be the unknown price of
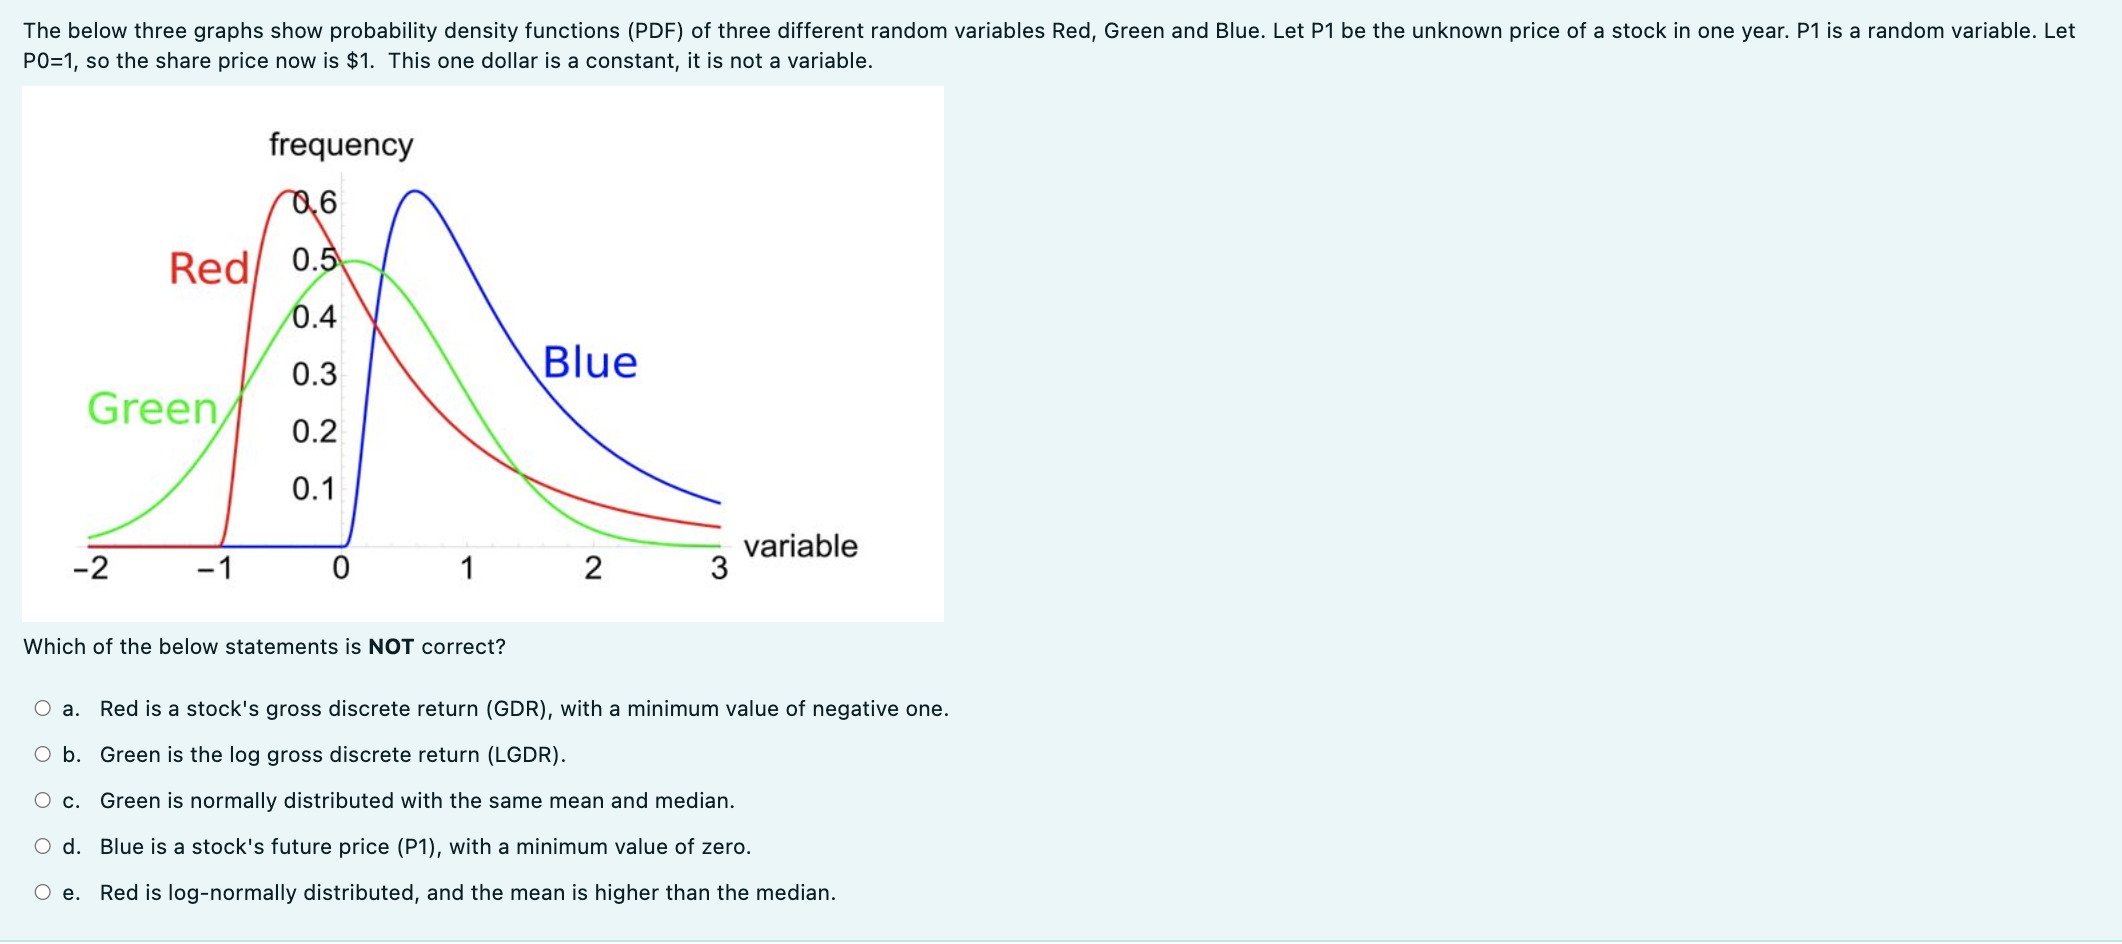
The below three graphs show probability density functions (PDF) of three different random variables Red, Green and Blue. Let P1 be the unknown price of a stock in one year. P1 is a random variable. Let PO=1, so the share price now is $1. This one dollar is a constant, it is not a variable. frequency 0.6 Red/ 0.5 0.4 0.3 Blue Green 0.2 0.1 -2 -1 0 1 2 variable 3 Which of the below statements is NOT correct? a. Red is a stock's gross discrete return (GDR), with a minimum value of negative one. O b. Green is the log gross discrete return (LGDR). O c. Green is normally distributed with the same mean and median. O d. Blue is a stock's future price (P1), with a minimum value of zero. O e. Red is log-normally distributed, and the mean is higher than the median. The below three graphs show probability density functions (PDF) of three different random variables Red, Green and Blue. Let P1 be the unknown price of a stock in one year. P1 is a random variable. Let PO=1, so the share price now is $1. This one dollar is a constant, it is not a variable. frequency 0.6 Red/ 0.5 0.4 0.3 Blue Green 0.2 0.1 -2 -1 0 1 2 variable 3 Which of the below statements is NOT correct? a. Red is a stock's gross discrete return (GDR), with a minimum value of negative one. O b. Green is the log gross discrete return (LGDR). O c. Green is normally distributed with the same mean and median. O d. Blue is a stock's future price (P1), with a minimum value of zero. O e. Red is log-normally distributed, and the mean is higher than the median
Step by Step Solution
There are 3 Steps involved in it

Get step-by-step solutions from verified subject matter experts