

Question: The blue boxes data are attached Use the NPV method to determine whether Sunway Products should invest in the following projects: Project A costs $275,000
The blue boxes data are attached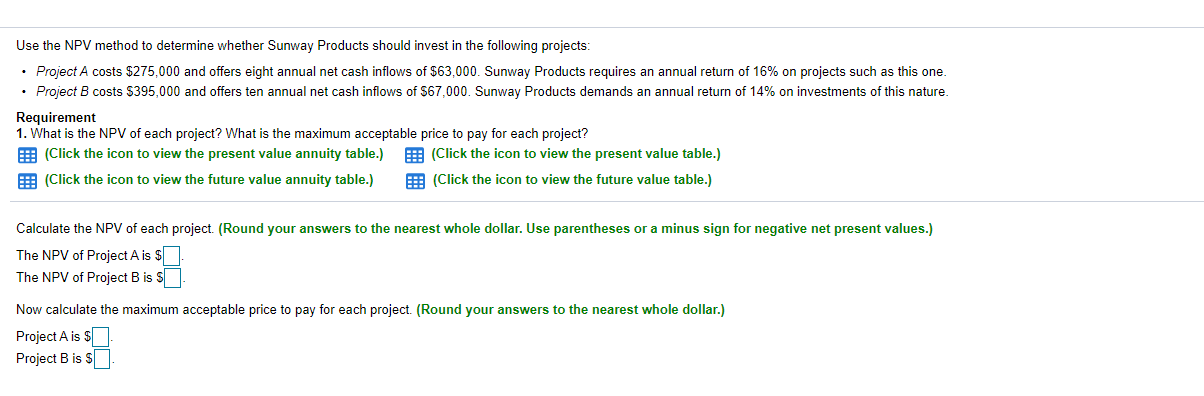
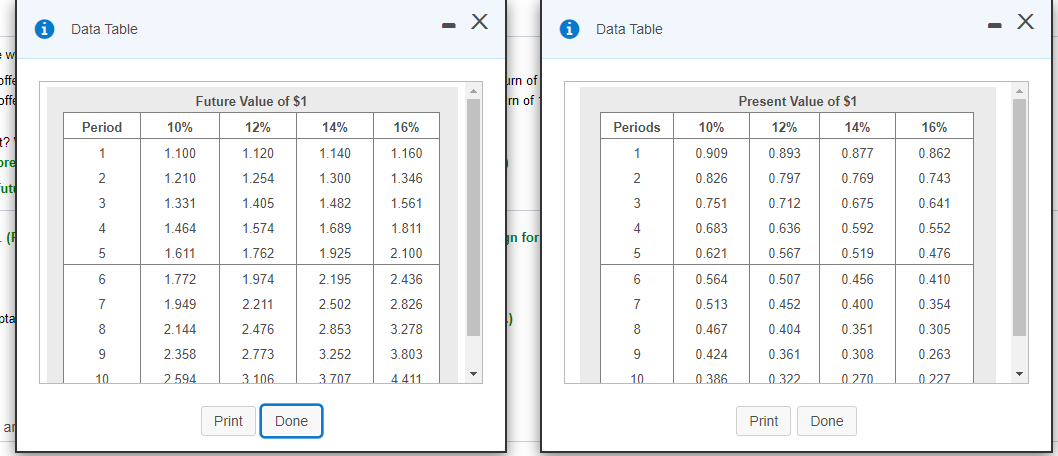
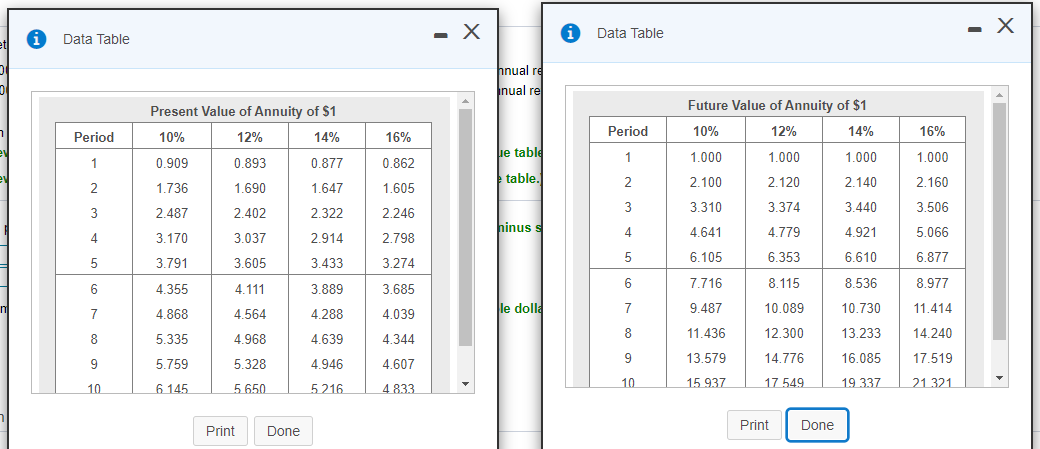
Use the NPV method to determine whether Sunway Products should invest in the following projects: Project A costs $275,000 and offers eight annual net cash inflows of $63,000. Sunway Products requires an annual return of 16% on projects such as this one. Project B costs $395,000 and offers ten annual net cash inflows of $67,000. Sunway Products demands an annual return of 14% on investments of this nature. Requirement 1. What is the NPV of each project? What is the maximum acceptable price to pay for each project? (Click the icon to view the present value annuity table.) (Click the icon to view the present value table.) (Click the icon to view the future value annuity table.) (Click the icon to view the future value table.) Calculate the NPV of each project. (Round your answers to the nearest whole dollar. Use parentheses or a minus sign for negative net present values.) The NPV of Project A is $ The NPV of Project B is S Now calculate the maximum acceptable price to pay for each project. (Round your answers to the nearest whole dollar.) Project A is $ Project B is $ 0 Data Table - X -X Data Table ew off urn of offe Future Value of $1 rn of Present Value of $1 Period 10% 12% 14% 16% Periods 10% 12% 14% 16% +? ore 1 1.100 1.120 1.140 1.160 1 0.909 0.893 0.877 0.862 2 1.210 1.254 1.300 1.346 2 0.826 0.797 0.769 0.743 ut 3 1.331 1.405 1.482 3 0.751 0.712 0.675 0.641 4 1.464 1.574 1.689 1.561 1.811 2.100 4 0.683 0.636 0.592 0.552 (C in for 5 1.611 1.762 1.925 5 0.621 0.567 0.519 0.476 6 1.772 1.974 2.195 2.436 6 0.564 0.507 0.456 0.410 7 1.949 2.211 2.502 2.826 7 0.513 0.452 0.400 0.354 ota 8 2.144 2.476 3.278 8 0.467 0.404 0.351 0.305 2.853 3.252 9 2.358 2.773 3.803 9 0.424 0.361 0.308 0.263 10 2594 3 106 3 707 4411 10 0386 0322 0270 0227 Print Done Print Done ar - X Data Table i Data Table - X hnual re Inual rel Present Value of Annuity of $1 12% 14% Future Value of Annuity of $1 10% 12% 14% Period Period 10% 16% 16% We table 0.909 0.893 0.877 1 1 0.862 1.000 1.000 1.000 1.000 table. 1.736 1.690 1.647 1.605 2 2 2.100 2.120 2.140 2.160 3 2.487 2.402 2.322 2.246 3.440 3 3.310 3.374 3.506 hinus & 4 3.170 4 3.037 2.914 2.798 4.641 4.779 4.921 5.066 3.791 3.605 5 3.433 3.274 5 6.105 6.353 6.610 6.877 6 4.355 7.716 8.115 6 8.977 4.111 8.536 3.685 3.889 4.288 n 4.868 4.564 7 le dolls 9.487 7 4.039 10.730 10.089 11.414 12.300 8 5.335 4.344 13.233 14.240 4.968 8 11.436 4.639 9 5.759 4.946 4.607 9 16.085 5.328 13.579 14.776 17.519 10 6 145 10 5 650 5 216 4833 15 937 17 549 19337 21 321 Print Done Print Done
Step by Step Solution
There are 3 Steps involved in it

Get step-by-step solutions from verified subject matter experts