

Question: The bottom figure shows a polymer matrix composite that is loaded in the fiber direction. Ef = 2 0 0 GPa,Em = 5 GPa, the
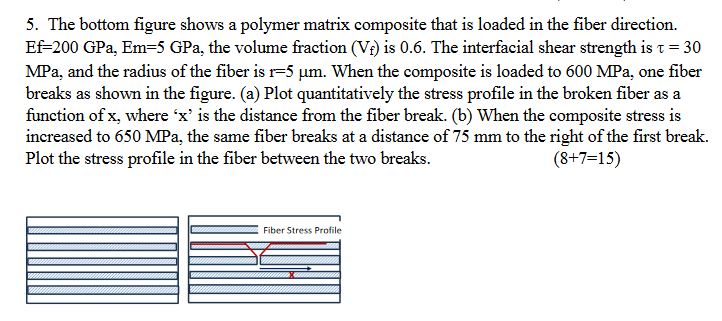
The bottom figure shows a polymer matrix composite that is loaded in the fiber direction. EfGPa,EmGPa, the volume fraction Vf is The interfacial shear strength is tau MPa and the radius of the fiber is rmum. When the composite is loaded to MPa one fiber
breaks as shown in the figure. a Plot quantitatively the stress profile in the broken fiber as a function of x where x is the distance from the fiber break. b When the composite stress is increased to MPa the same fiber breaks at a distance of mm to the right of the first break.
Plot the stress profile in the fiber between the two breaks.
Step by Step Solution
There are 3 Steps involved in it
1 Expert Approved Answer
Step: 1 Unlock

Question Has Been Solved by an Expert!
Get step-by-step solutions from verified subject matter experts
Step: 2 Unlock
Step: 3 Unlock