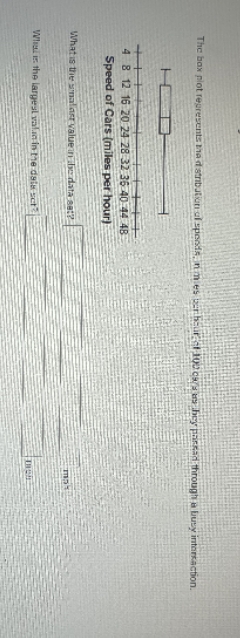
Question: The box plot represents the i'mbution al speeds, him es barbour al today's as they passed through a busy intoreaction. 4 8 12 16 20

The box plot represents the i'mbution al
The box plot represents the i'mbution al speeds, him es barbour al today's as they passed through a busy intoreaction. 4 8 12 16 20 24 28 32 35 40 44 48 Speed of Cars (miles per hour) What is the smalart value in the data out? What in the largest value in the dyle set

Step by Step Solution

There are 3 Steps involved in it

1 Expert Approved Answer
Step: 1 Unlock blur-text-image
Question Has Been Solved by an Expert!

Get step-by-step solutions from verified subject matter experts

Step: 2 Unlock
Step: 3 Unlock

Students Have Also Explored These Related Mathematics Questions!