

Question: Statement The box plot represents the distribution of speeds, in miles per hour, of 100 cars as they passed through a busy intersection. 8 12
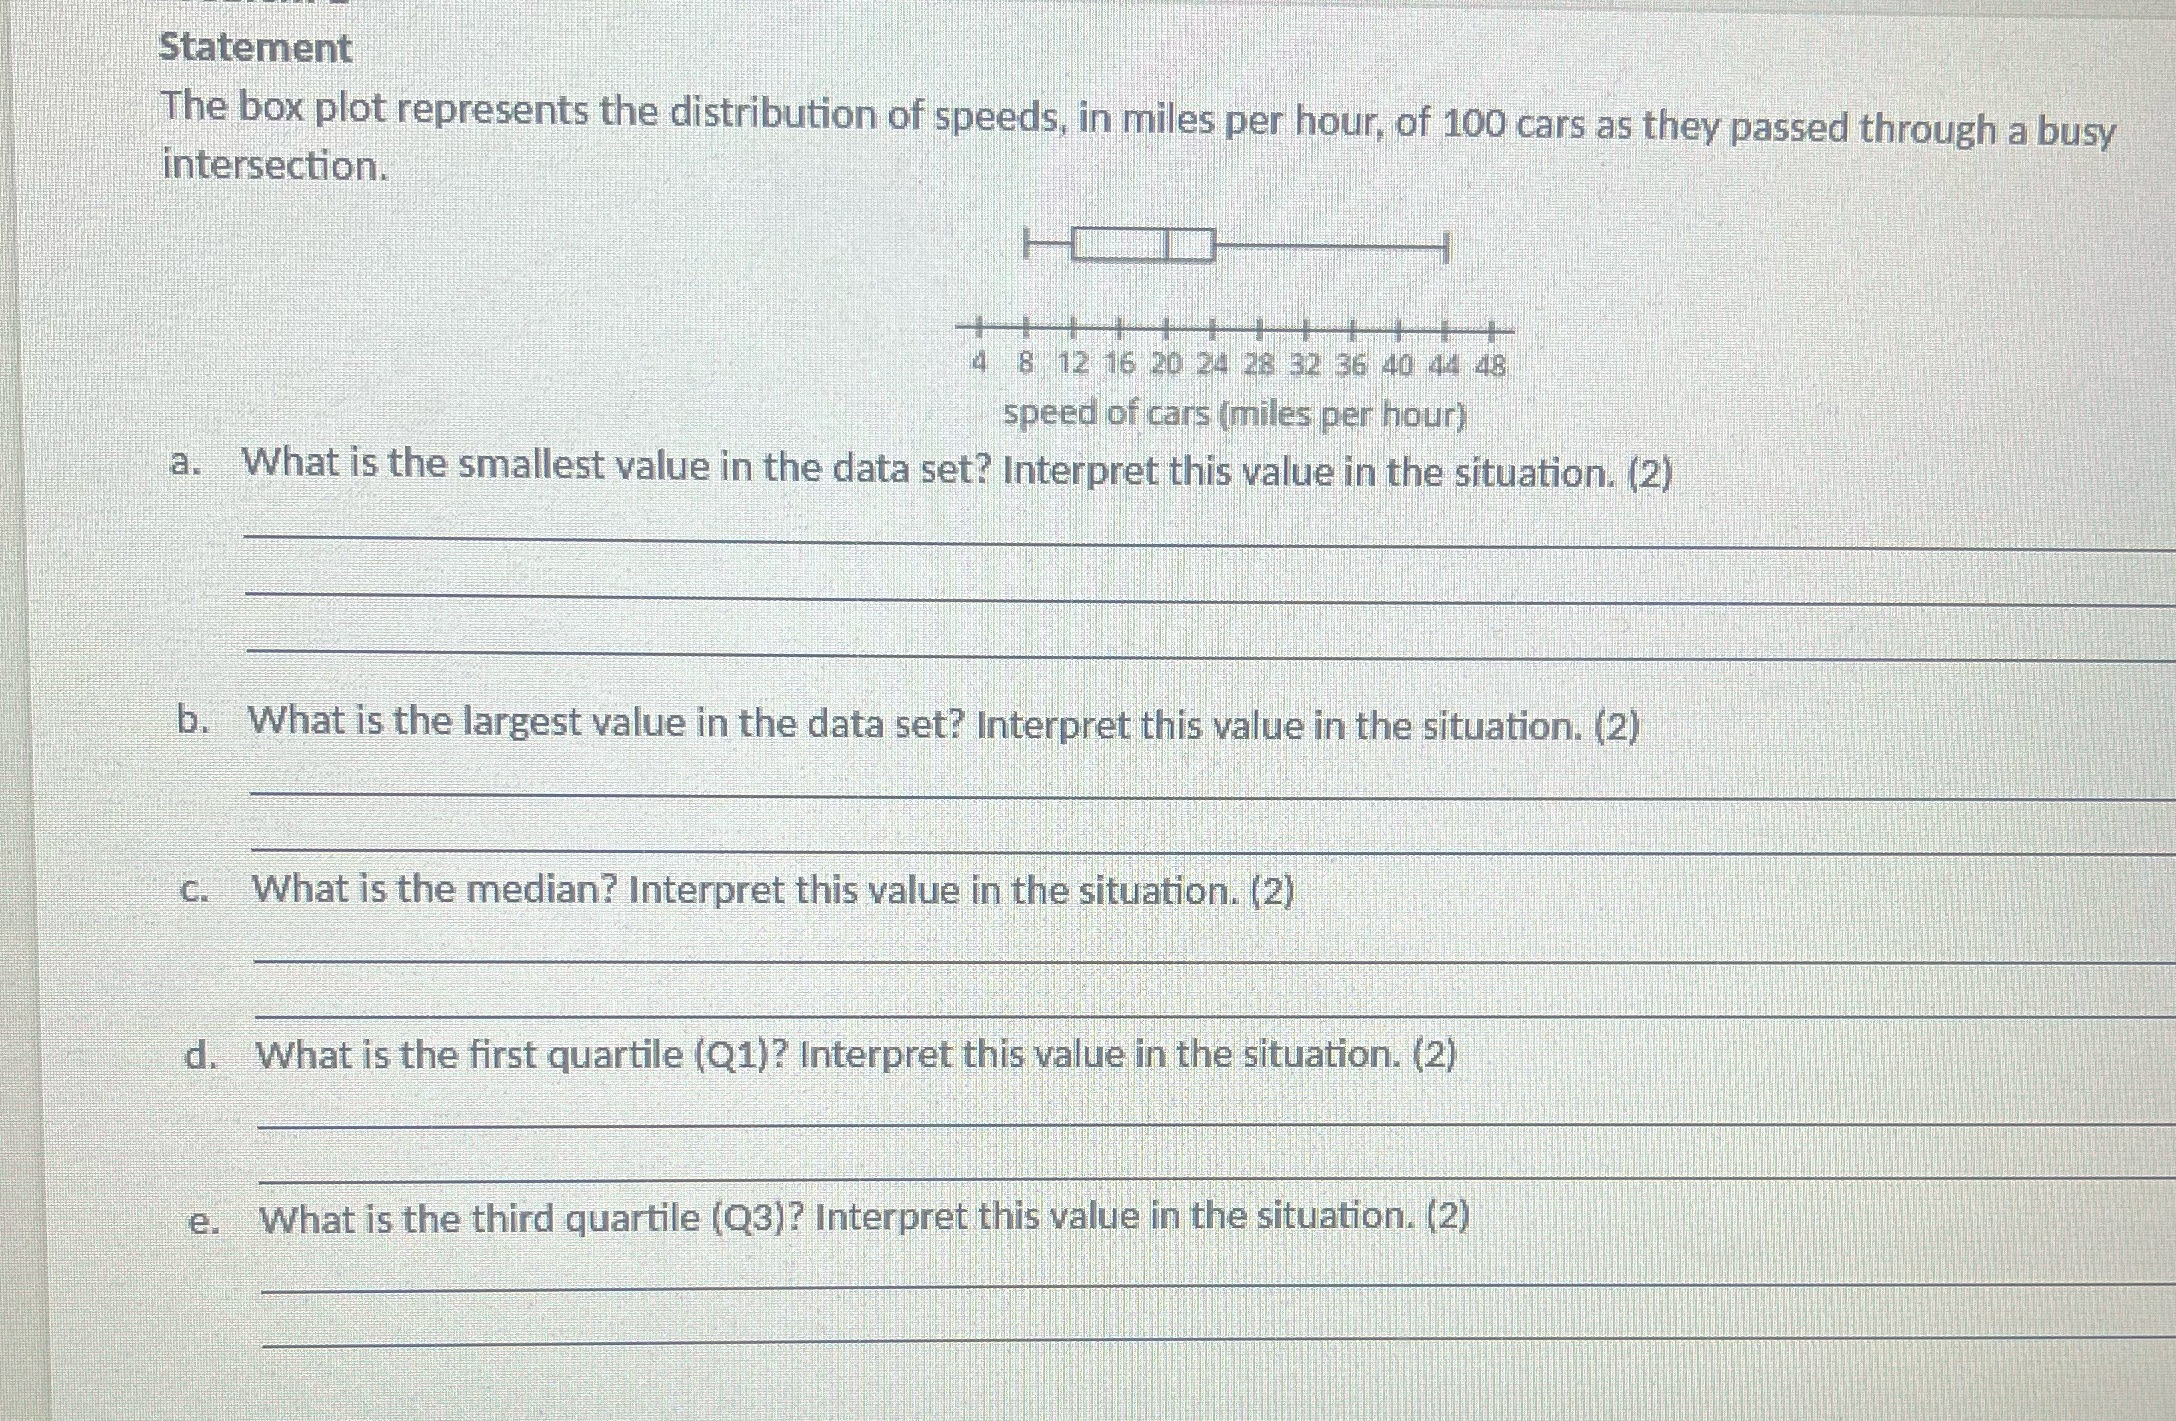
Statement The box plot represents the distribution of speeds, in miles per hour, of 100 cars as they passed through a busy intersection. 8 12 16 20 24 28 32 36 40 44 48 speed of cars (miles per hour) a. What is the smallest value in the data set? Interpret this value in the situation. (2) b. What is the largest value in the data set? Interpret this value in the situation. (2) c. What is the median? Interpret this value in the situation. (2) d. What is the first quartile (Q1)? Interpret this value in the situation. (2) e. What is the third quartile (Q3)? Interpret this value in the situation. (2)
Step by Step Solution
There are 3 Steps involved in it
1 Expert Approved Answer
Step: 1 Unlock

Question Has Been Solved by an Expert!
Get step-by-step solutions from verified subject matter experts
Step: 2 Unlock
Step: 3 Unlock