

Question: the boxes in green View Insert Format Tools Data Window 3% Fri 10:09 PM a Excel File Edit AutoSaver Help CapBudgeting WACC Complete (1) -
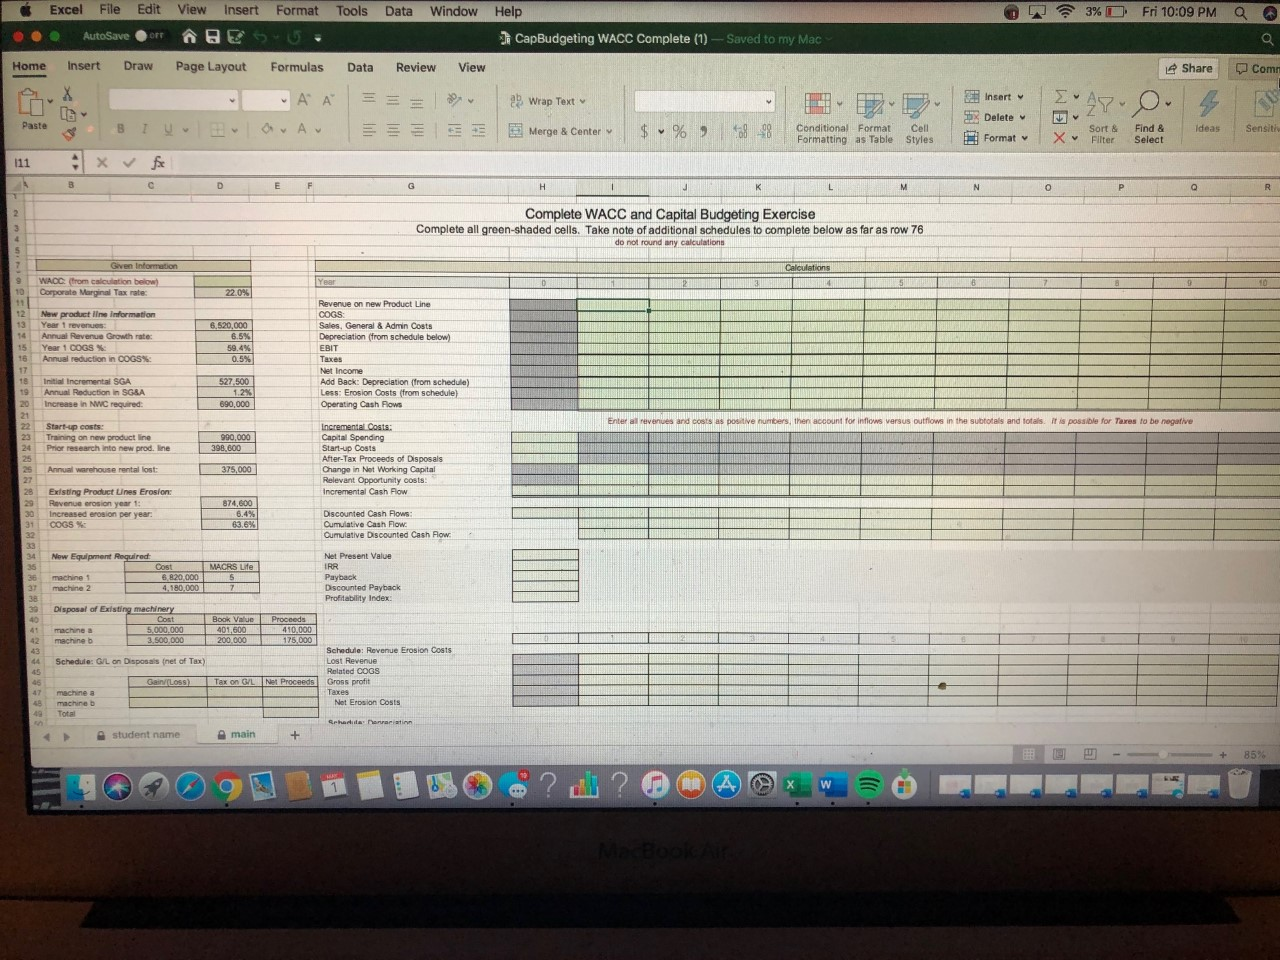
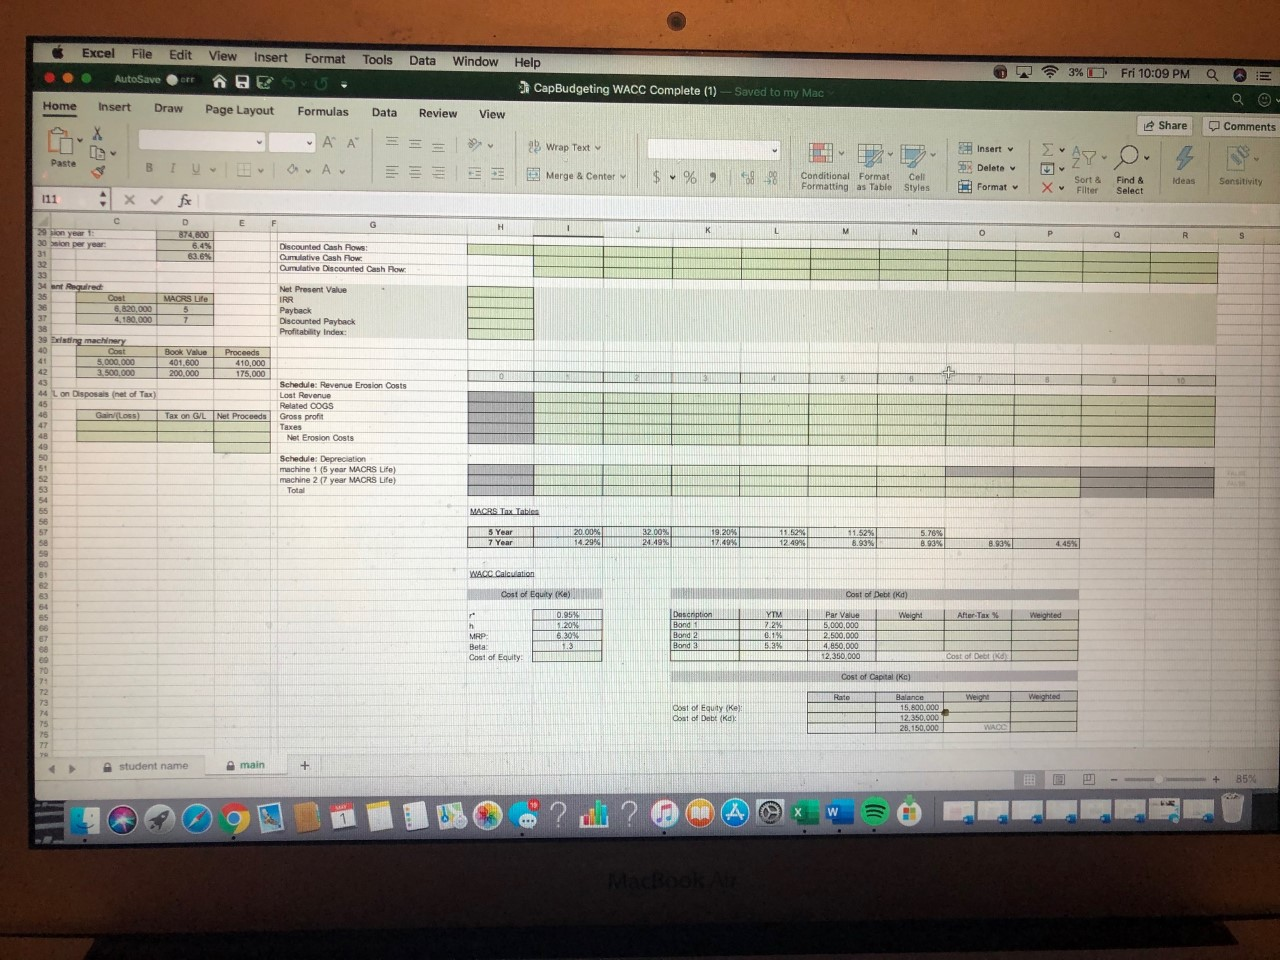 the boxes in green
View Insert Format Tools Data Window 3% Fri 10:09 PM a Excel File Edit AutoSaver Help CapBudgeting WACC Complete (1) - Saved to my Mac Home Insert Draw Page Layout Formulas Data Review View Share Com = = = Bw LE AA so I obra. Av x v for Wrap Text Merge & Center Insert 3Delete Format Paste $ % , 98 Conditional Format Formatting as Table Cell Styles Sort & Filter Ideas Sensit X Find & Select 111 Complete WACC and Capital Budgeting Exercise Complete all green-shaded cells. Take note of additional schedules to complete below as far as row 76 do not found any calculations WAOC Monc tion below Corporate Marginal Tax rate New product information Yet revenues Annual Revenue Growth rate Year 1 COGS Annual reduction in COGS S520.000 6.5% ht 0.5% Revenue on new Product Line COGS Sales, General & Admin Costs Depreciation from schedule below) EBIT Taxes Net Income Add Back: Depreciation (from schedule) Less: Erosion Costs (from schedule) Operating Cash Flows THE 19 Initial incrementa SGA Annual Reduction in SGRA Increase in NWC required: 527.500 1.2% 690.000 1 humbers, the account for inflows versus outflows in the subtotals and totals. It is possible for Taxes to be negative Start-up costs Training on new product line Prior research into new prod. line 990,000 398.600 Incremental Costs Capital Spending Start-up costs After-Tax Proceeds of Disposals Change in Not Working Capital Relevant Opportunity costs Incremental Cash Flow 25 Annual warehouse rental lost: 375,000 874,600 Existing Product Lines Erosion Revenue erosion year 1: Increased erosion per year: COGS 63.6% Discounted Cash Flows: Cumulative Cash Flow Cumulative Discounted Cash Flow New Equipment Required machine machine 2 6.820.000 4,180,000 Net Present Value IRR Payback Discounted Payback Profitability Index Book Value Disposal of Existing machinery Cost machine a 5.000.000 machine b 31500 000 Schedule: G/L on Disposals fnet of Tax) Schedule: Revenue Erosion Costs Lost Revenue Related COGS Gross profit Taxes Net Erosion Costs Loss) Tax machine a machine Tots student name main Tools 3%D Fri 10:09 PM a E Excel File Edit AutoSave Home Insert Draw View Insert Format @ESU Page Layout Formulas Data Data Window Help CapBudgeting WACC Complete (1) - Saved to my Mac Review View = = ? Wrap Text Marge & Center $ % , og Share Comments = A A & BI va. Au Insert Delete Format 27.04 ZT Conditional Format Formatting as Table Cell Styles Sort & Filter Ideas X Find & Select Sonsitivity D 7100 per year Discounted Cash Rows Cumulative Cash Flow Cumulative Discounted Cash Row &stab 88XXX88988 Net Present Value IRR Payback Discounted Payback Profitability Index 4. 120 ng machinery 5.000.000 3.500.000 200.000 Lon Disposnet of Tax) Schedule: Revenue Erosion Costs Lost Revenue Related COGS Gross profit Taxes Net Erosion Costs Tax on GL Net Proceeds Schedule: Depreciation machine 15 year MACRS Life) machine 27 year MACRS Life) Total MACRS Tax Table 5 Year 7 Year WACC Calculation Cost of Equity ke Cost of Deck Zana 8988288 98889889 Ahorax 2.500.000 Bond 3 5 Cost of Equity Cost of Capital (KC) Cost of Equity Kel O of Deti (ko 28.150,000 student name main -- - + 85% View Insert Format Tools Data Window 3% Fri 10:09 PM a Excel File Edit AutoSaver Help CapBudgeting WACC Complete (1) - Saved to my Mac Home Insert Draw Page Layout Formulas Data Review View Share Com = = = Bw LE AA so I obra. Av x v for Wrap Text Merge & Center Insert 3Delete Format Paste $ % , 98 Conditional Format Formatting as Table Cell Styles Sort & Filter Ideas Sensit X Find & Select 111 Complete WACC and Capital Budgeting Exercise Complete all green-shaded cells. Take note of additional schedules to complete below as far as row 76 do not found any calculations WAOC Monc tion below Corporate Marginal Tax rate New product information Yet revenues Annual Revenue Growth rate Year 1 COGS Annual reduction in COGS S520.000 6.5% ht 0.5% Revenue on new Product Line COGS Sales, General & Admin Costs Depreciation from schedule below) EBIT Taxes Net Income Add Back: Depreciation (from schedule) Less: Erosion Costs (from schedule) Operating Cash Flows THE 19 Initial incrementa SGA Annual Reduction in SGRA Increase in NWC required: 527.500 1.2% 690.000 1 humbers, the account for inflows versus outflows in the subtotals and totals. It is possible for Taxes to be negative Start-up costs Training on new product line Prior research into new prod. line 990,000 398.600 Incremental Costs Capital Spending Start-up costs After-Tax Proceeds of Disposals Change in Not Working Capital Relevant Opportunity costs Incremental Cash Flow 25 Annual warehouse rental lost: 375,000 874,600 Existing Product Lines Erosion Revenue erosion year 1: Increased erosion per year: COGS 63.6% Discounted Cash Flows: Cumulative Cash Flow Cumulative Discounted Cash Flow New Equipment Required machine machine 2 6.820.000 4,180,000 Net Present Value IRR Payback Discounted Payback Profitability Index Book Value Disposal of Existing machinery Cost machine a 5.000.000 machine b 31500 000 Schedule: G/L on Disposals fnet of Tax) Schedule: Revenue Erosion Costs Lost Revenue Related COGS Gross profit Taxes Net Erosion Costs Loss) Tax machine a machine Tots student name main Tools 3%D Fri 10:09 PM a E Excel File Edit AutoSave Home Insert Draw View Insert Format @ESU Page Layout Formulas Data Data Window Help CapBudgeting WACC Complete (1) - Saved to my Mac Review View = = ? Wrap Text Marge & Center $ % , og Share Comments = A A & BI va. Au Insert Delete Format 27.04 ZT Conditional Format Formatting as Table Cell Styles Sort & Filter Ideas X Find & Select Sonsitivity D 7100 per year Discounted Cash Rows Cumulative Cash Flow Cumulative Discounted Cash Row &stab 88XXX88988 Net Present Value IRR Payback Discounted Payback Profitability Index 4. 120 ng machinery 5.000.000 3.500.000 200.000 Lon Disposnet of Tax) Schedule: Revenue Erosion Costs Lost Revenue Related COGS Gross profit Taxes Net Erosion Costs Tax on GL Net Proceeds Schedule: Depreciation machine 15 year MACRS Life) machine 27 year MACRS Life) Total MACRS Tax Table 5 Year 7 Year WACC Calculation Cost of Equity ke Cost of Deck Zana 8988288 98889889 Ahorax 2.500.000 Bond 3 5 Cost of Equity Cost of Capital (KC) Cost of Equity Kel O of Deti (ko 28.150,000 student name main -- - + 85%
Step by Step Solution
There are 3 Steps involved in it

Get step-by-step solutions from verified subject matter experts