

Question: The boxplot below shows the precipitation in San Diego, CA (in inches) over the past 30 years. In how many of those years was
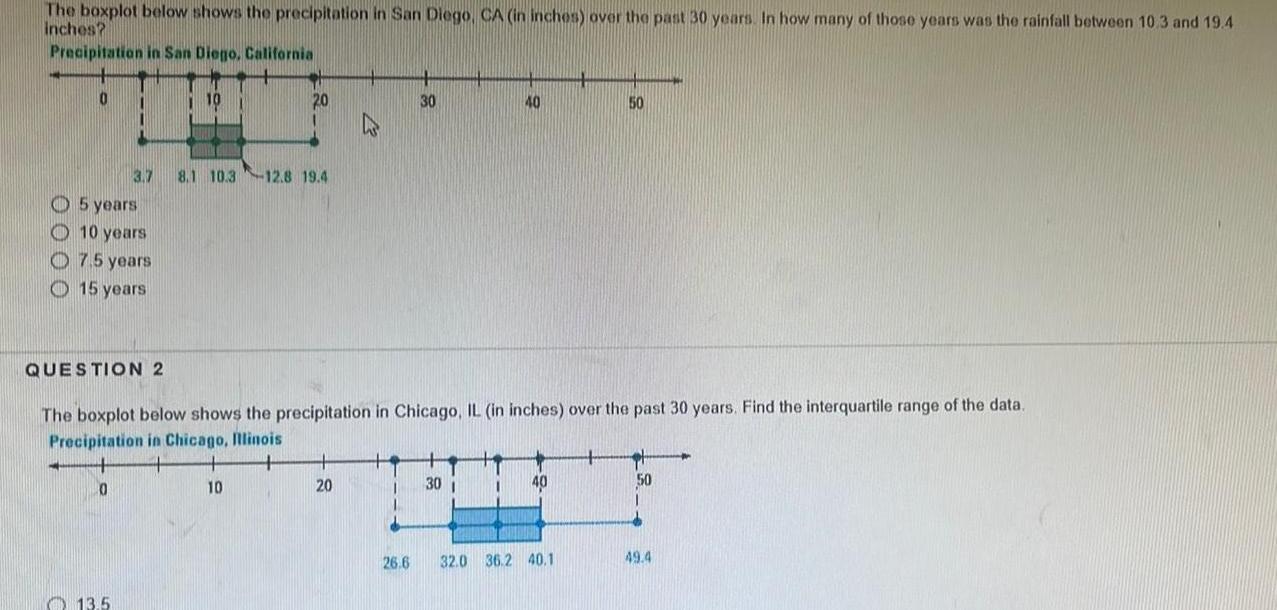
The boxplot below shows the precipitation in San Diego, CA (in inches) over the past 30 years. In how many of those years was the rainfall between 10.3 and 19.4 inches? Precipitation in San Diego, California 0 20 30 40 50 3.7 8.1 10.3 12.8 19.4 5 years 10 years 7.5 years 15 years QUESTION 2 The boxplot below shows the precipitation in Chicago, IL (in inches) over the past 30 years. Find the interquartile range of the data. Precipitation in Chicago, Illinois 0 13.5 10 20 30 40 50 26.6 32.0 36.2 40.1 49.4
Step by Step Solution
There are 3 Steps involved in it
1 Expert Approved Answer
Step: 1 Unlock

Question Has Been Solved by an Expert!
Get step-by-step solutions from verified subject matter experts
Step: 2 Unlock
Step: 3 Unlock