

Question: The case provides performance information for Zynga for the years 2019 through 2021. For each item listed below, calculate the rate of annual growth
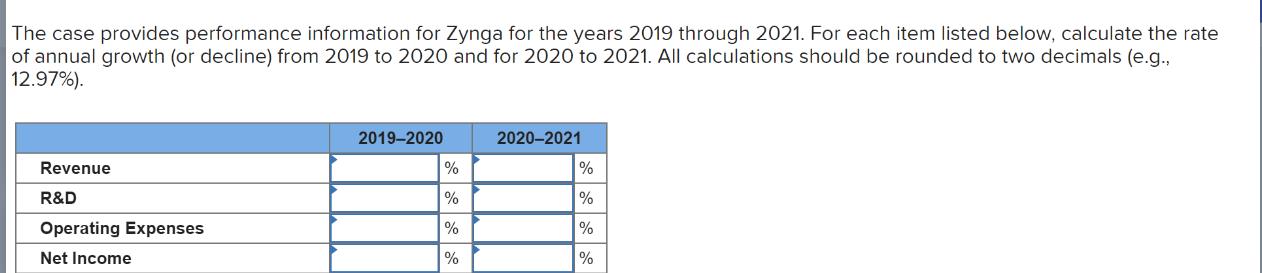
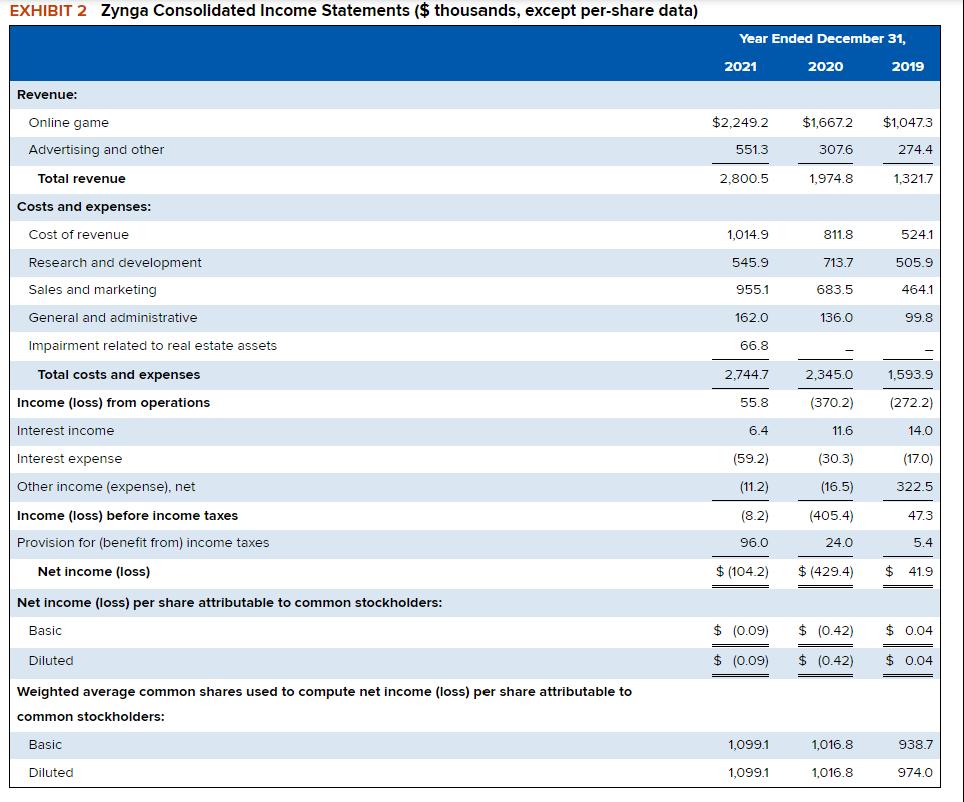
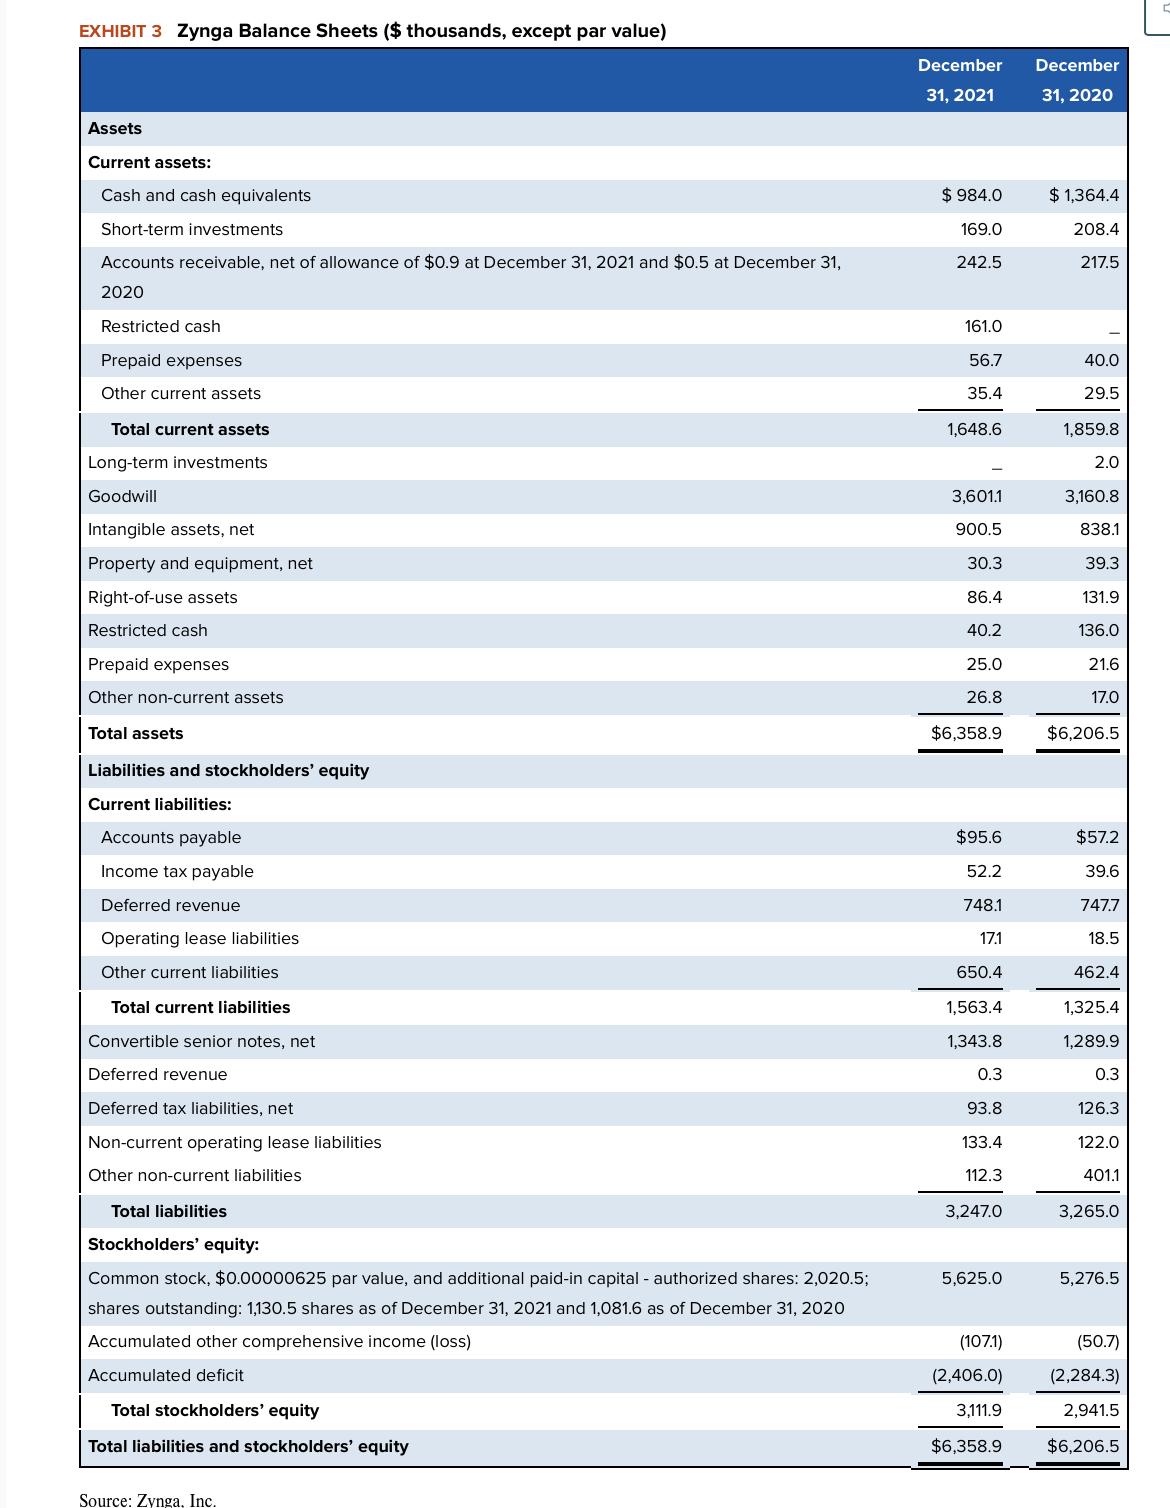
The case provides performance information for Zynga for the years 2019 through 2021. For each item listed below, calculate the rate of annual growth (or decline) from 2019 to 2020 and for 2020 to 2021. All calculations should be rounded to two decimals (e.g., 12.97%). Revenue R&D Operating Expenses Net Income 2019-2020 % % % % 2020-2021 % % % % EXHIBIT 2 Zynga Consolidated Income Statements ($ thousands, except per-share data) Revenue: Online game Advertising and other Total revenue Costs and expenses: Cost of revenue Research and development Sales and marketing General and administrative Impairment related to real estate assets Total costs and expenses Income (loss) from operations Interest income Interest expense Other income (expense), net Income (loss) before income taxes Provision for (benefit from) income taxes Net income (loss) Net income (loss) per share attributable to common stockholders: Basic Diluted Weighted average common shares used to compute net income (loss) per share attributable to common stockholders: Basic Diluted Year Ended December 31, 2021 $2,249.2 551.3 2,800.5 1,014.9 545.9 955.1 162.0 66.8 2,744.7 55.8 6.4 (59.2) (11.2) (8.2) 96.0 $(104.2) $ (0.09) $ (0.09) 1,099.1 1,099.1 2020 $1,667.2 $1,047.3 307.6 274.4 1,321.7 1,974.8 811.8 713.7 683.5 136.0 2,345.0 (370.2) 11.6 (30.3) (16.5) (405.4) 24.0 $ (429.4) $ (0.42) $ (0.42) 2019 1,016.8 1,016.8 524.1 $ 505.9 464.1 99.8 1,593.9 (272.2) 14.0 (17.0) 322.5 47.3 5.4 41.9 $0.04 $ 0.04 938.7 974.0 EXHIBIT 3 Zynga Balance Sheets ($ thousands, except par value) Assets Current assets: Cash and cash equivalents Short-term investments Accounts receivable, net of allowance of $0.9 at December 31, 2021 and $0.5 at December 31, 2020 Restricted cash Prepaid expenses Other current assets Total current assets Long-term investments Goodwill Intangible assets, net Property and equipment, net Right-of-use assets Restricted cash Prepaid expenses Other non-current assets Total assets Liabilities and stockholders' equity Current liabilities: Accounts payable Income tax payable Deferred revenue Operating lease liabilities Other current liabilities Total current liabilities Convertible senior notes, net Deferred revenue Deferred tax liabilities, net Non-current operating lease liabilities Other non-current liabilities Total liabilities Stockholders' equity: Common stock, $0.00000625 par value, and additional paid-in capital - authorized shares: 2,020.5; shares outstanding: 1,130.5 shares as of December 31, 2021 and 1,081.6 as of December 31, 2020 Accumulated other comprehensive income (loss) Accumulated deficit Total stockholders' equity Total liabilities and stockholders' equity Source: Zynga, Inc. December 31, 2021 $984.0 169.0 242.5 161.0 56.7 35.4 1,648.6 3,601.1 900.5 30.3 86.4 40.2 25.0 26.8 $6,358.9 $95.6 52.2 748.1 17.1 650.4 1,563.4 1,343.8 0.3 93.8 133.4 112.3 3,247.0 5,625.0 (107.1) (2,406.0) 3,111.9 $6,358.9 December 31, 2020 $1,364.4 208.4 217.5 40.0 29.5 1,859.8 3,160.8 838.1 39.3 131.9 136.0 21.6 17.0 $6,206.5 $57.2 39.6 747.7 18.5 462.4 1,325.4 1,289.9 0.3 126.3 122.0 401.1 3,265.0 5,276.5 (50.7) (2,284.3) 2,941.5 $6,206.5
Step by Step Solution
3.38 Rating (154 Votes )
There are 3 Steps involved in it
ANSWER To calculate the annual growth rate or decline for each item from 2019 to 2020 and from 2020 to 2021 we need to compare the values for these years Lets calculate the growth rates for each item ... View full answer

Get step-by-step solutions from verified subject matter experts