

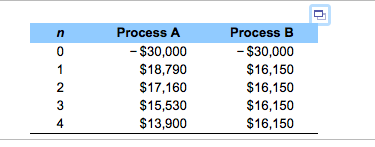
Question: The cash flows in the table below represent the potential annual savings associated with two different types of productionprocesses, each of which requires an investment
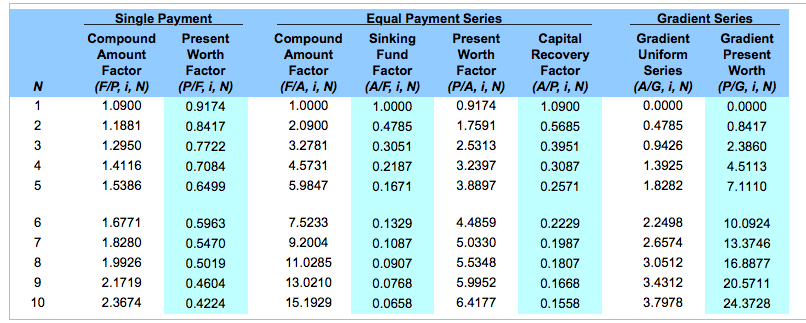
The cash flows in the table below represent the potential annual savings associated with two different types of productionprocesses, each of which requires an investment of $30,000. Assume an interest rate of 9%.
Please answer a), b), c). thanks
(a) Determine the equivalent annual savings for each process The equivalent annual savings for process A are $ The equivalent annual savings for process B are S(Round to the nearest dollar.) (b) Determine the hourly savings for each process if will be in operation of 3,000 hours per year. The hourly savings for process A are S(Round to the nearest cent.) The hourly savings for process B are .(Round to the nearest cent.) (c) Which process should be selected? Choose the correct answer below. O Process A O Process B (Round to the nearest dollar.)
Step by Step Solution
There are 3 Steps involved in it

Get step-by-step solutions from verified subject matter experts