

Question: The cash flows in the table below represent the potential annual savings associated with two different types of production processes, each of which requires an
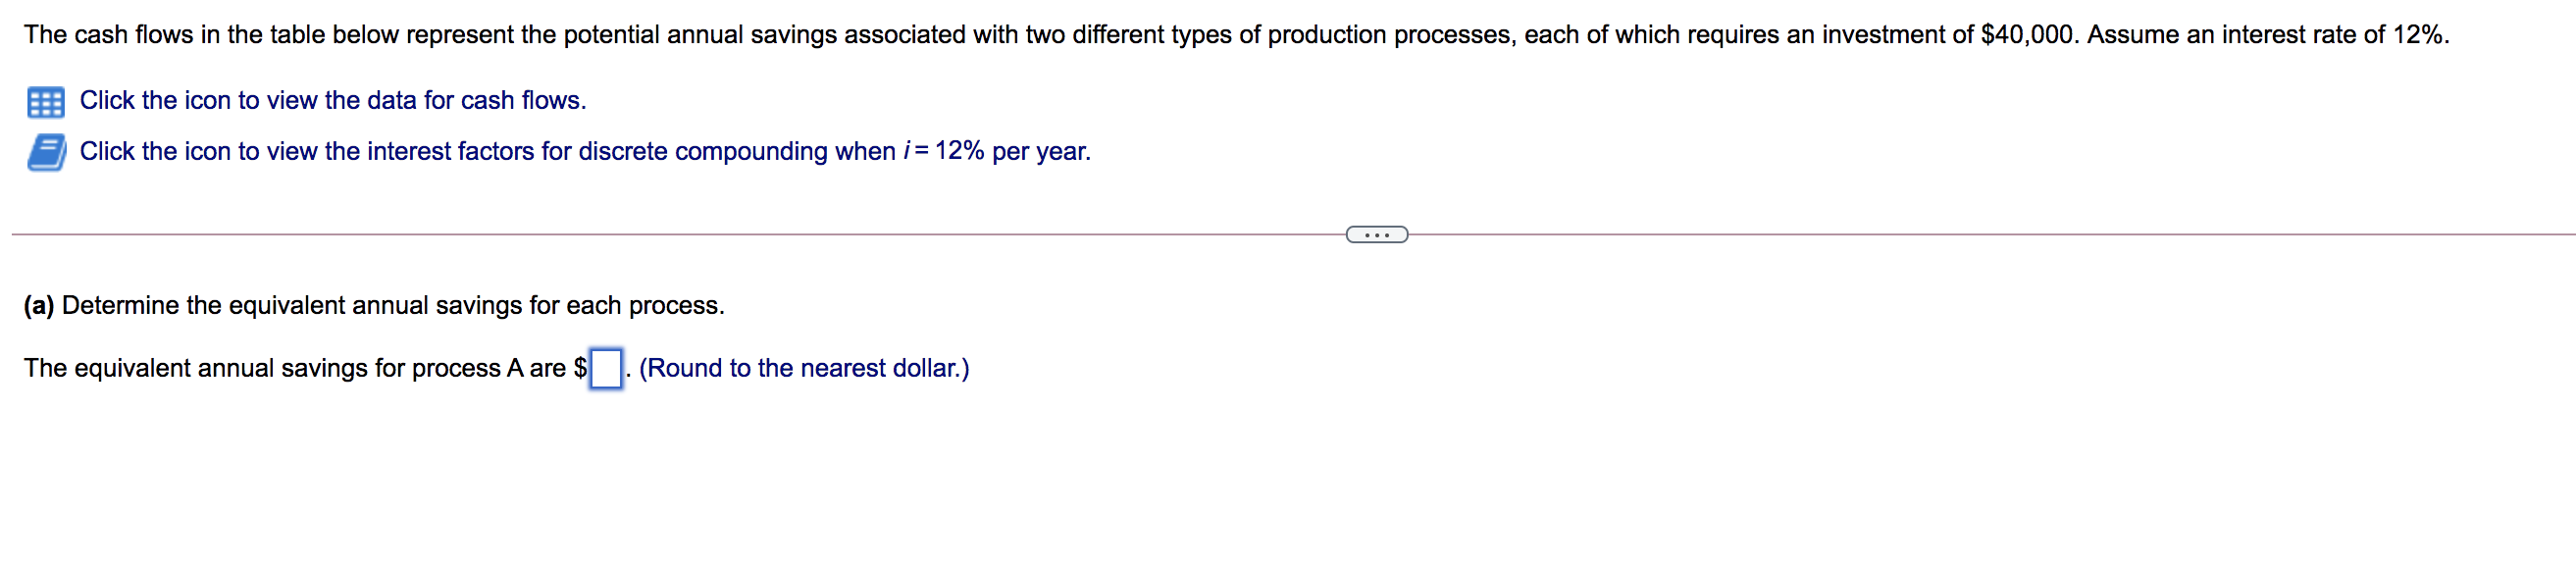
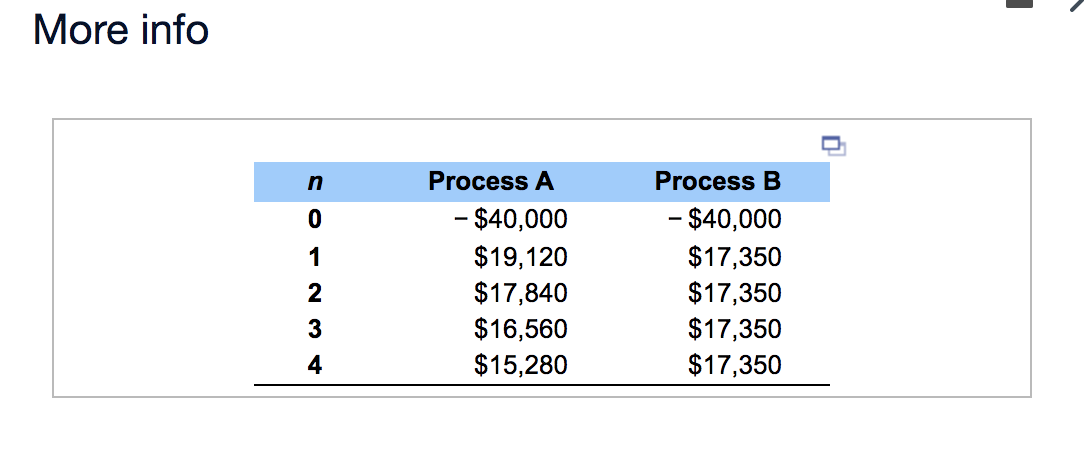
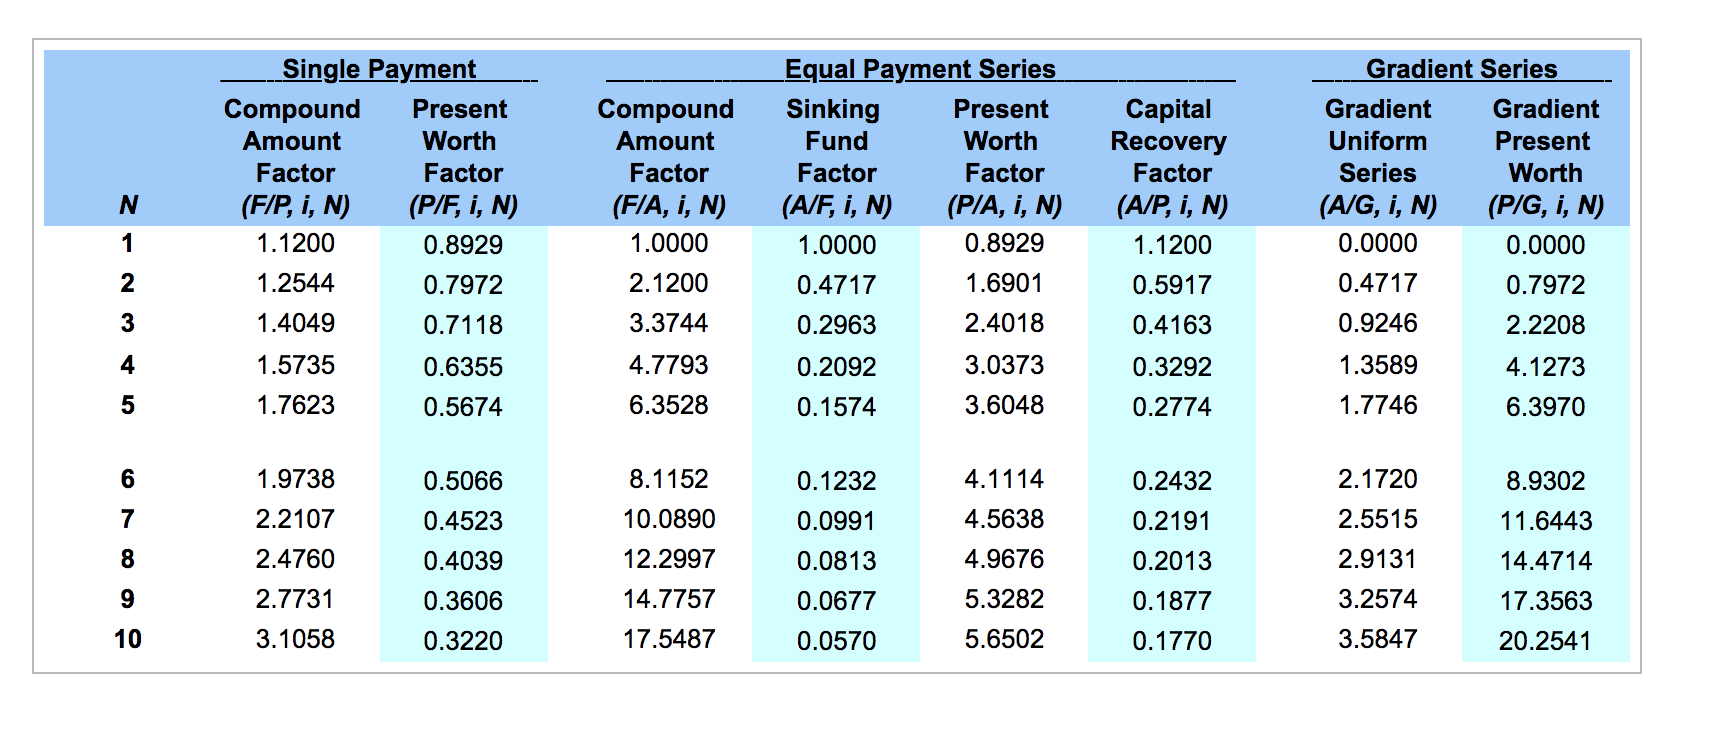
The cash flows in the table below represent the potential annual savings associated with two different types of production processes, each of which requires an investment of $40,000. Assume an interest rate of 12%. Click the icon to view the data for cash flows. Click the icon to view the interest factors for discrete compounding when i = 12% per year. (a) Determine the equivalent annual savings for each process. The equivalent annual savings for process A are $ - (Round to the nearest dollar.) More info n 0 1 A NOS Process A - $40,000 $19,120 $17,840 $16,560 $15,280 Process B - $40,000 $17,350 $17,350 $17,350 $17,350 2 3 4 Gradient Series Single Payment Compound Present Amount Worth Factor Factor (F/P, i, N) (PIF, i, N) 1.1200 0.8929 1.2544 0.7972 1.4049 0.7118 N Compound Amount Factor (F/A, i, N) 1.0000 2.1200 Capital Recovery Factor (A/P, I, N) 1.1200 0.5917 Gradient Uniform Series (A/G, I, N) 0.0000 Equal Payment Series Sinking Present Fund Worth Factor Factor (A/F, i, N) (P/A, I, N) 1.0000 0.8929 0.4717 1.6901 0.2963 2.4018 0.2092 3.0373 0.1574 3.6048 Gradient Present Worth (P/G, I, N) 0.0000 0.7972 2.2208 1 2 0.4717 0.9246 3 3.3744 0.4163 4 1.5735 0.6355 4.7793 1.3589 0.3292 0.2774 4.1273 6.3970 5 1.7623 0.5674 6.3528 1.7746 6 0.5066 8.1152 4.1114 0.2432 2.1720 8.9302 1.9738 2.2107 2.4760 0.1232 0.0991 7 0.4523 4.5638 2.5515 11.6443 10.0890 12.2997 0.2191 0.2013 8 0.4039 0.0813 14.4714 4.9676 5.3282 2.9131 3.2574 9 2.7731 0.3606 14.7757 0.1877 17.3563 0.0677 0.0570 10 3.1058 0.3220 17.5487 5.6502 0.1770 3.5847 20.2541
Step by Step Solution
There are 3 Steps involved in it

Get step-by-step solutions from verified subject matter experts