

Question: The Centers for Disease Control (CDC) keeps data on what it calls Winnable Battle Risk Factors and Health Indicators. These are negative behaviors or
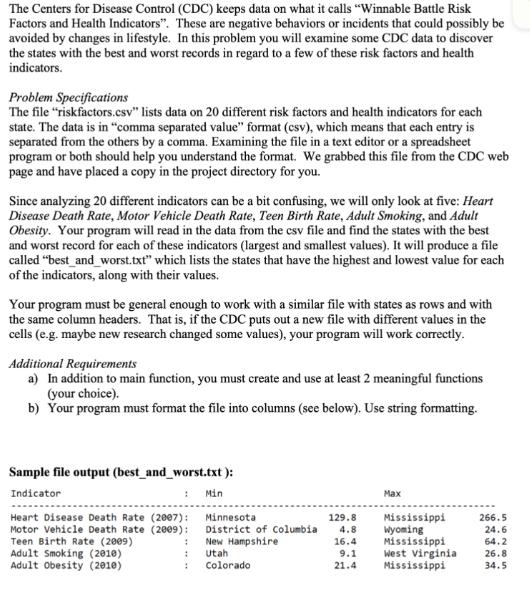
The Centers for Disease Control (CDC) keeps data on what it calls "Winnable Battle Risk Factors and Health Indicators". These are negative behaviors or incidents that could possibly be avoided by changes in lifestyle. In this problem you will examine some CDC data to discover the states with the best and worst records in regard to a few of these risk factors and health indicators. Problem Specifications The file "risk factors.csv" lists data on 20 different risk factors and health indicators for each state. The data is in "comma separated value" format (csv), which means that each entry is separated from the others by a comma. Examining the file in a text editor or a spreadsheet program or both should help you understand the format. We grabbed this file from the CDC web page and have placed a copy in the project directory for you. Since analyzing 20 different indicators can be a bit confusing, we will only look at five: Heart Disease Death Rate, Motor Vehicle Death Rate, Teen Birth Rate, Adult Smoking, and Adult Obesity. Your program will read in the data from the csv file and find the states with the best and worst record for each of these indicators (largest and smallest values). It will produce a file called "best_and_worst.txt" which lists the states that have the highest and lowest value for each of the indicators, along with their values. Your program must be general enough to work with a similar file with states as rows and with the same column headers. That is, if the CDC puts out a new file with different values in the cells (e.g. maybe new research changed some values), your program will work correctly. Additional Requirements a) In addition to main function, you must create and use at least 2 meaningful functions (your choice). b) Your program must format the file into columns (see below). Use string formatting. Sample file output (best_and_worst.txt): Indicator : Heart Disease Death Rate (2007): Motor Vehicle Death Rate (2009): Teen Birth Rate (2009) Adult Smoking (2010) Adult Obesity (2010) 1 : : Min Minnesota District of Columbia New Hampshire Utah Colorado 129.8 4.8 16.4 9.1 21.4 Max Mississippi Wyoming Mississippi West Virginia Mississippi 266.5 24.6 64.2 26.8 34.5
Step by Step Solution
There are 3 Steps involved in it
Follow the below code Code import string def minmaxnewlistcause Listofdiseases listofdiseases for disease in cause column newlist for row in newlist The newnum nos noNA noflt and nornd are just words ... View full answer

Get step-by-step solutions from verified subject matter experts