

Question: The chart below shows the tariff rates applied on different stages of production. Explain why across all regions, tariff rates on agricultures are higher than
The chart below shows the tariff rates applied on different stages of production. Explain why across all regions, tariff rates on agricultures are higher than on manufactures.
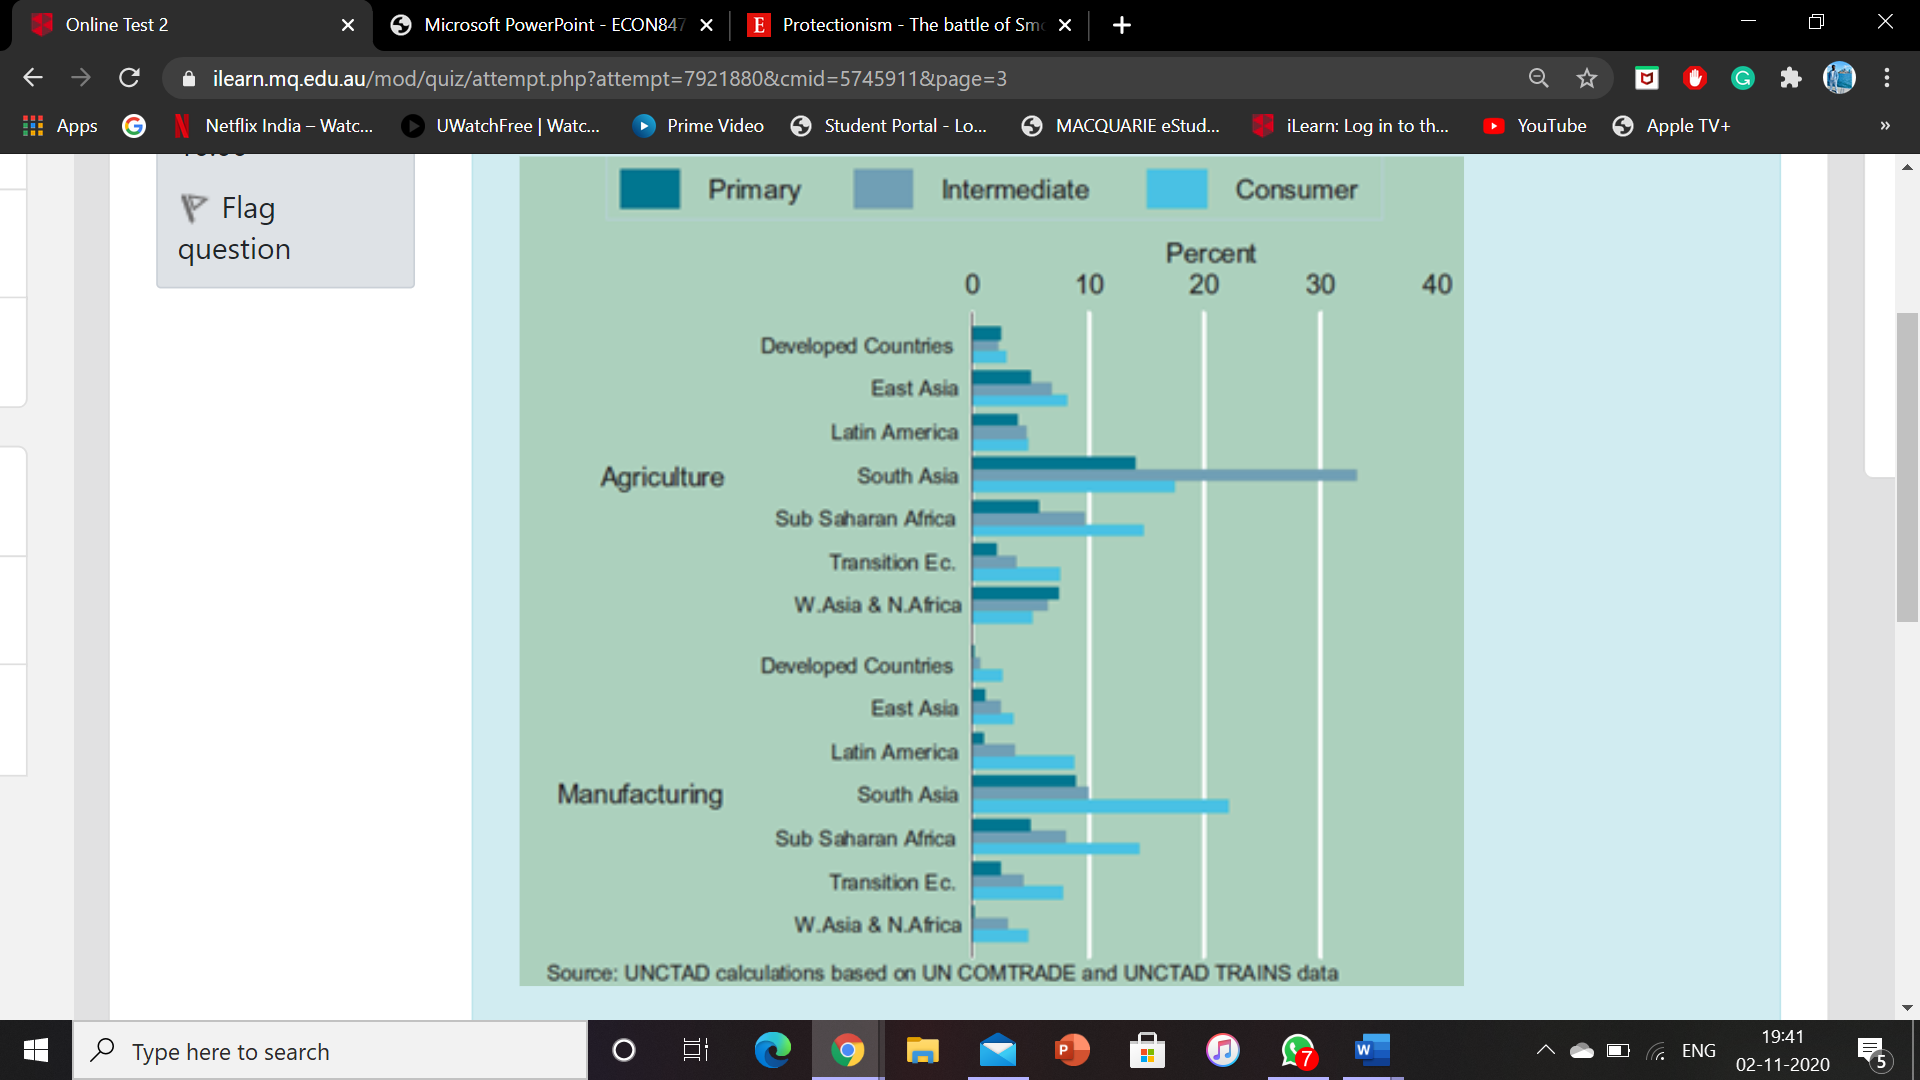
Online Test 2 X 5 Microsoft PowerPoint - ECON847 x E Protectionism - The battle of Smc X X - C ilearn.mq.edu.au/mod/quiz/attempt.php?attempt=7921880&cmid=5745911&page=3 G . . . Apps G N Netflix India - Watc... UWatchFree | Watc. Prime Video Student Portal - Lo.. MACQUARIE eStud. iLearn: Log in to th... YouTube Apple TV+ Flag Primary Intermediate Consumer question Percent 0 10 20 30 40 Developed Countries East Asia Latin America Agriculture South Asia Sub Saharan Africa Transition Ec. W.Asia & N.Africa Developed Countries East Asia Latin America Manufacturing South Asia Sub Saharan Africa Transition Ec. W.Asia & N.Africa Source: UNCTAD calculations based on UN COMTRADE and UNCTAD TRAINS data Type here to search O M P W 19:41 02-11-2020 FE
Step by Step Solution
There are 3 Steps involved in it

Get step-by-step solutions from verified subject matter experts