

Question: The chart below shows the tariff rates applied on different stages of production. Explain why across all regions, tariff rates on agricultures are higher than
The chart below shows the tariff rates applied on different stages of production. Explain why across all regions, tariff rates on agricultures are higher than on manufactures.
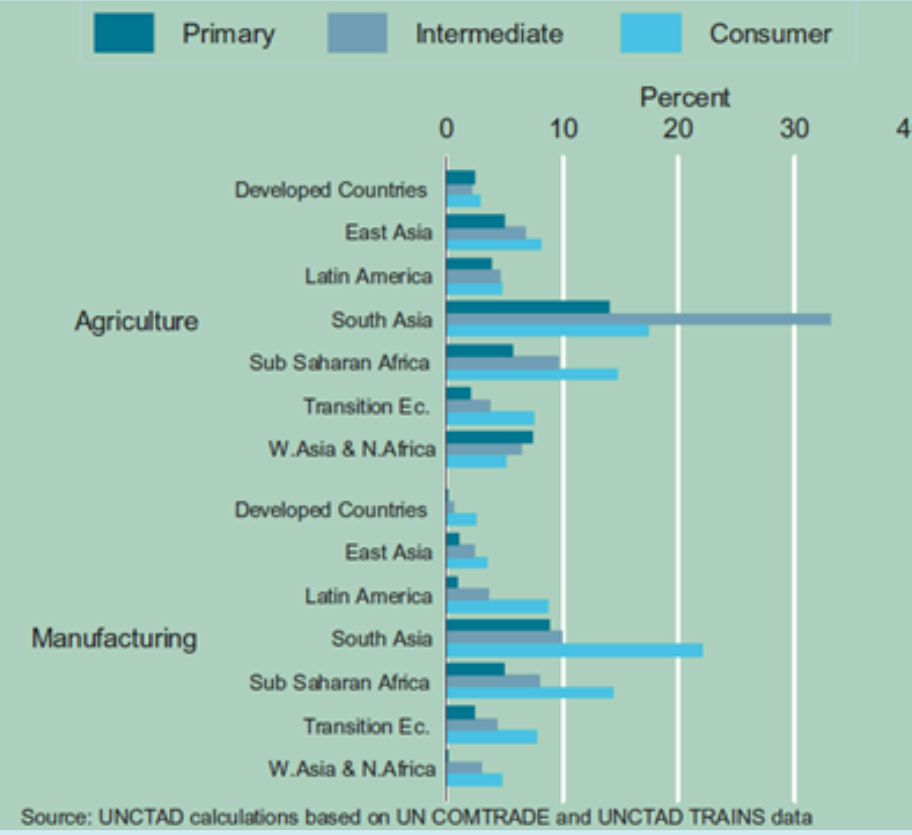
Primary Intermediate Consumer Percent O 10 20 30 Developed Countries East Asia Latin America Agriculture South Asia Sub Saharan Africa Transition Ec. W.Asia & N.Africa Developed Countries East Asia Latin America Manufacturing South Asia Sub Saharan Africa Transition Ec. W.Asia & N.Africa Source: UNCTAD calculations based on UN COMTRADE and UNCTAD TRAINS data
Step by Step Solution
There are 3 Steps involved in it
1 Expert Approved Answer
Step: 1 Unlock

Question Has Been Solved by an Expert!
Get step-by-step solutions from verified subject matter experts
Step: 2 Unlock
Step: 3 Unlock