

Question: The chart represents a data set's given values, predicted values (using a line of best fit for the data), and residual values. Which are
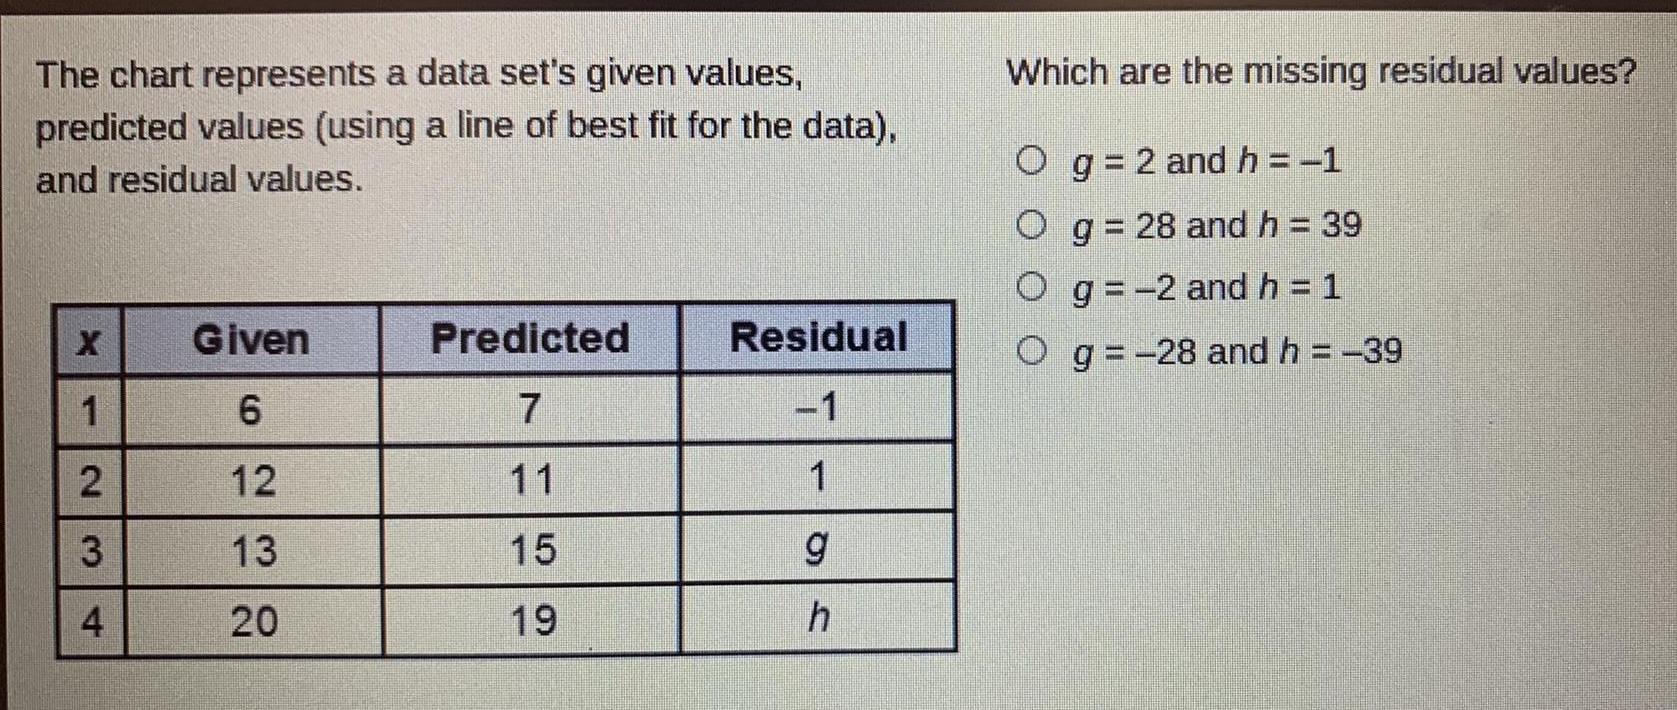
The chart represents a data set's given values, predicted values (using a line of best fit for the data), and residual values. Which are the missing residual values? O g=2 and h = -1 O g = 28 and h = 39 O g = -2 and h = 1 X Given Predicted Residual Og=-28 and h = -39 1 6 7 -1 2 12 11 1 3 13 15 g 4 20 19 h
Step by Step Solution
There are 3 Steps involved in it
1 Expert Approved Answer
Step: 1 Unlock

Question Has Been Solved by an Expert!
Get step-by-step solutions from verified subject matter experts
Step: 2 Unlock
Step: 3 Unlock