

Question: The Cineplex worksheet in the data pack represents revenue (measured in millions of dollars) generated by the movie theater chain from Q1-2014 to Q4-2018. a.Construct
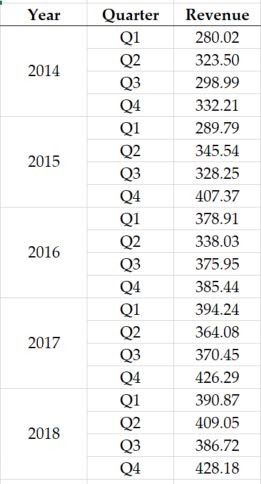
The "Cineplex" worksheet in the data pack represents revenue (measured in millions of dollars) generated by the movie theater chain from Q1-2014 to Q4-2018.
a.Construct the quarterly seasonal indexes.
[insert table of organized calculations here]
b.Interpret the quarterly seasonal indexes.
[insert interpretations here]
c.Seasonally adjust the time series and estimate a linear trend equation. Use the seasonally adjusted time series as the dependent variable. (4 marks)
[insert screenshot of regression output here]
[insert formula for the regression equation here]
d.Forecast Cineplex's revenue for each quarter in 2020.
[insert table of organized calculations here]
\f
Step by Step Solution
There are 3 Steps involved in it

Get step-by-step solutions from verified subject matter experts