

Question: The code for this chart is : # Define Function 3 below: def plot _ station _ counts _ per _ year ( df ,
The code for this chart is : # Define Function below:
def plotstationcountsperyeardf title:
dfYear Opened' dfOpen Date'str:
yearsgrouped dfgroupbyYear Opened'
yearcounts yearsgroupedYear Opened'aggcount
fig, ax pltsubplots
axplotyearcounts.index, yearcounts.values
axsettitletitle
axsetxlabelYear
axsetylabelCount
pltshow#
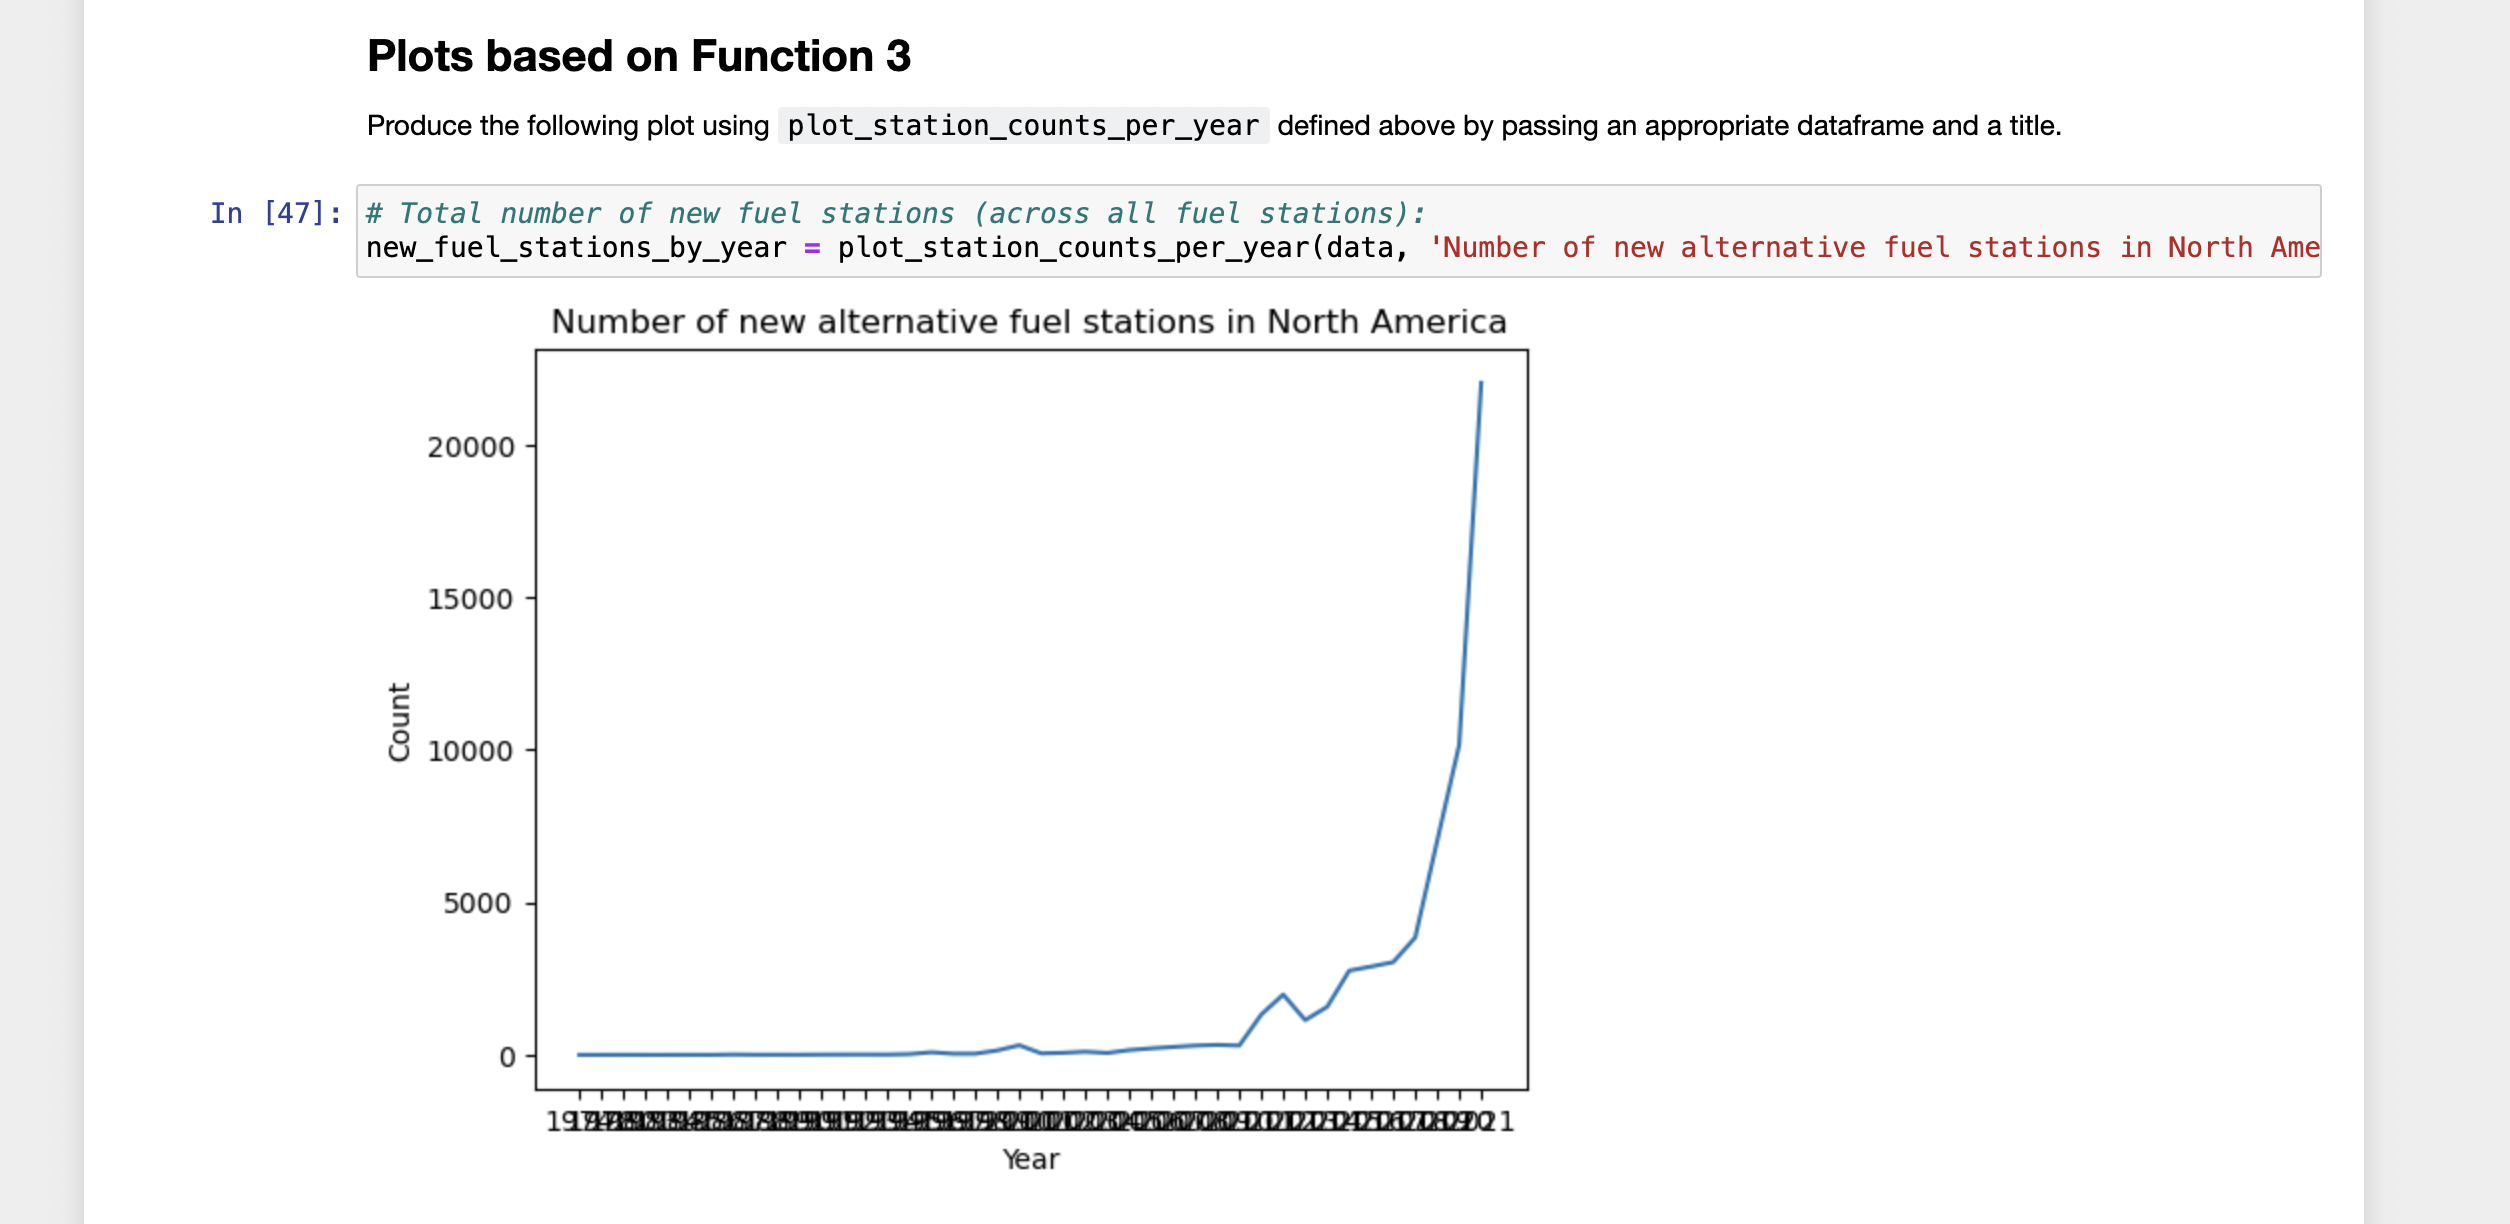
Total number of new fuel stations across all fuel stations:
newfuelstationsbyyear plotstationcountsperyeardata 'Number of new alternative fuel stations in North America'
we need to filter the years on the x axis to
Step by Step Solution
There are 3 Steps involved in it
1 Expert Approved Answer
Step: 1 Unlock

Question Has Been Solved by an Expert!
Get step-by-step solutions from verified subject matter experts
Step: 2 Unlock
Step: 3 Unlock