

Question: The code is to be written in Python programming in the Jupyter Notebooks environment. Use Gurobi (gurobipy) to optimize the code for the models. Columns
The code is to be written in Python programming in the Jupyter Notebooks environment.
Use Gurobi (gurobipy) to optimize the code for the models.
Columns in LRTrain.csv and LRTest.csv: radius_mean , texture_mean , perimeter_mean , area_mean , smoothness_mean , compactness_mean , concavity_mean , concave points_mean , symmetry_mean , fractal_dimension_mean , radius_se , texture_se , perimeter_se , area_se , smoothness_se , compactness_se , concavity_se , concave points_se , symmetry_se , fractal_dimension_se , radius_worst , texture_worst , perimeter_worst , area_worst , smoothness_worst , compactness_worst , concavity_worst , concave points_worst , symmetry_worst , fractal_dimension_worst , diagnosis
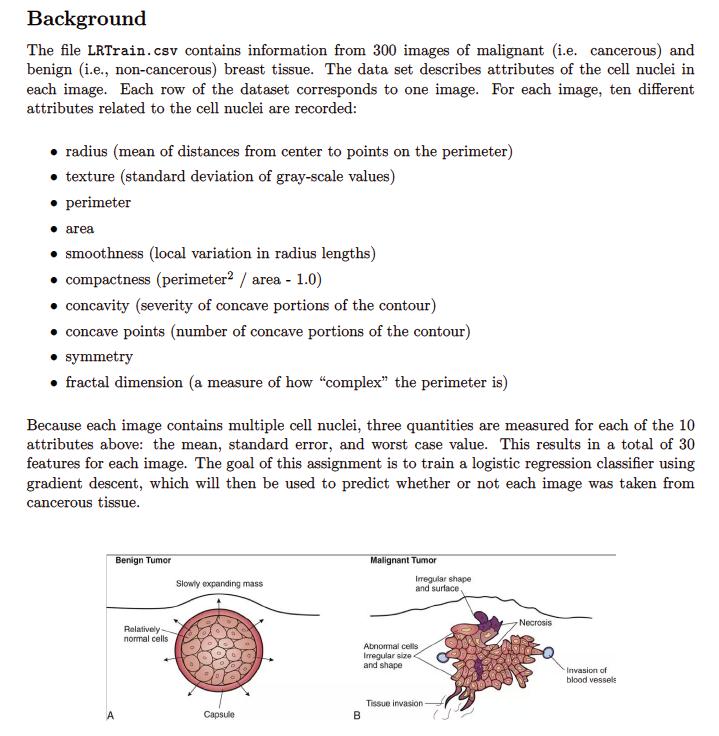
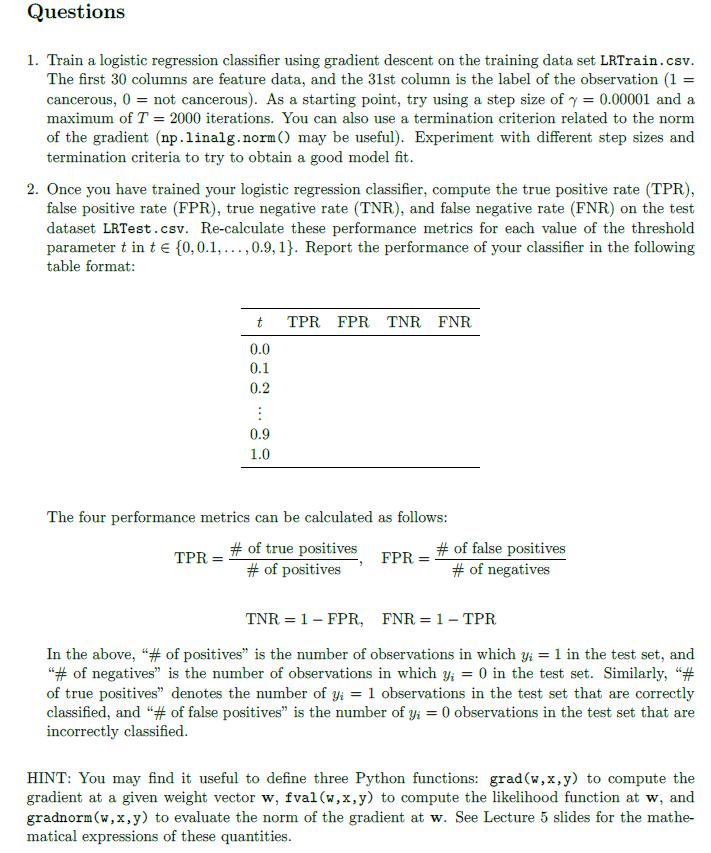
The file LRTrain.csv contains information from 300 images of malignant (i.e. cancerous) and benign (i.e., non-cancerous) breast tissue. The data set describes attributes of the cell nuclei in each image. Each row of the dataset corresponds to one image. For each image, ten different attributes related to the cell nuclei are recorded: - radius (mean of distances from center to points on the perimeter) - texture (standard deviation of gray-scale values) - perimeter - area - smoothness (local variation in radius lengths) - compactness (perimeter 2/ area - 1.0) - concavity (severity of concave portions of the contour) - concave points (number of concave portions of the contour) - symmetry - fractal dimension (a measure of how "complex" the perimeter is) Because each image contains multiple cell nuclei, three quantities are measured for each of the 10 attributes above: the mean, standard error, and worst case value. This results in a total of 30 features for each image. The goal of this assignment is to train a logistic regression classifier using gradient descent, which will then be used to predict whether or not each image was taken from cancerous tissue. 1. Train a logistic regression classifier using gradient descent on the training data set LRTrain.csv. The first 30 columns are feature data, and the 31 st column is the label of the observation (1= cancerous, 0= not cancerous). As a starting point, try using a step size of =0.00001 and a maximum of T=2000 iterations. You can also use a termination criterion related to the norm of the gradient (np.linalg.norm() may be useful). Experiment with different step sizes and termination criteria to try to obtain a good model fit. 2. Once you have trained your logistic regression classifier, compute the true positive rate (TPR), false positive rate (FPR), true negative rate (TNR), and false negative rate (FNR) on the test dataset LRTest.csv. Re-calculate these performance metrics for each value of the threshold parameter t in t{0,0.1,,0.9,1}. Report the performance of your classifier in the following table format: The four performance metrics can be calculated as follows: TPR=#ofpositives#oftruepositives,FPR=#ofnegatives#offalsepositivesTNR=1FPR,FNR=1TPR In the above, "\# of positives" is the number of observations in which yi=1 in the test set, and "\# of negatives" is the number of observations in which yi=0 in the test set. Similarly, "\# of true positives" denotes the number of yi=1 observations in the test set that are correctly classified, and "\# of false positives" is the number of yi=0 observations in the test set that are incorrectly classified. HINT: You may find it useful to define three Python functions: grad (w,x,y) to compute the gradient at a given weight vector w,fval(w,x,y) to compute the likelihood function at w, and gradnorm(w,x,y) to evaluate the norm of the gradient at w. See Lecture 5 slides for the mathematical expressions of these quantities
Step by Step Solution
There are 3 Steps involved in it

Get step-by-step solutions from verified subject matter experts