

Question: The coin size data (measured in millimeters) collected from each group is shown below. Low Income High Income 23 17 19 24 18 17 33
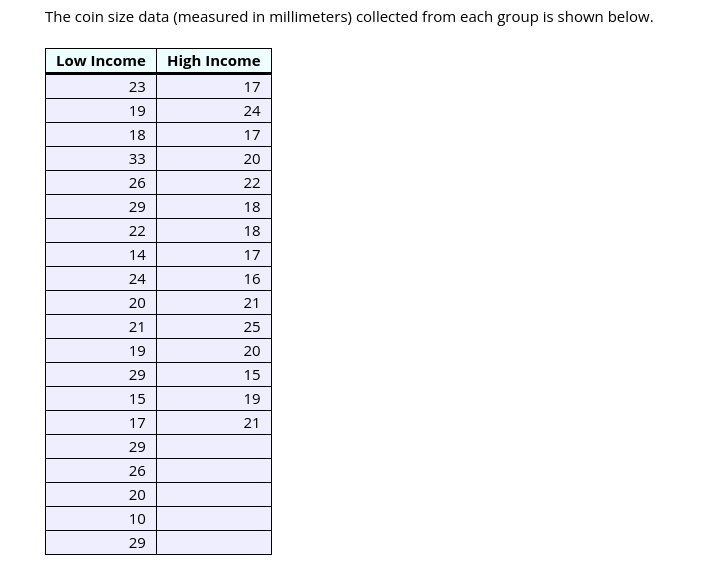
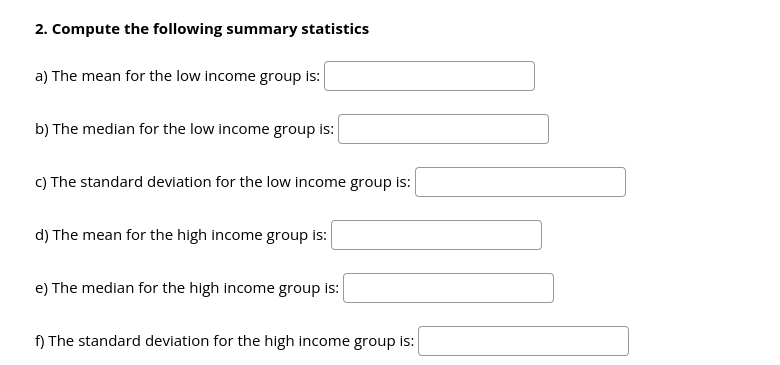
The coin size data (measured in millimeters) collected from each group is shown below. Low Income High Income 23 17 19 24 18 17 33 20 26 22 29 18 22 18 14 17 24 16 20 21 21 25 19 20 29 15 15 19 17 21 29 26 20 10 292. Compute the following summary statistics a) The mean for the low income group is: b) The median for the low income group is: c) The standard deviation for the low income group is: d) The mean for the high income group is: e) The median for the high income group is: f) The standard deviation for the high income group is
Step by Step Solution
There are 3 Steps involved in it
1 Expert Approved Answer
Step: 1 Unlock

Question Has Been Solved by an Expert!
Get step-by-step solutions from verified subject matter experts
Step: 2 Unlock
Step: 3 Unlock