

Question: The column input for the data table highlights the changing assumptions for _____ . a. intrinsic share price b. terminal-period sales growth c. horizon-period sales
The column input for the data table highlights the changing assumptions for _____ .
| a. | intrinsic share price | |
| b. | terminal-period sales growth | |
| c. | horizon-period sales growth | |
| d. | cost of capital |
The row input for the data table highlights the changing assumptions for _____ .
| a. | cost of equity capital | |
| b. | intrinsic share price | |
| c. | terminal-period sales growth | |
| d. | horizon-period sales growth |
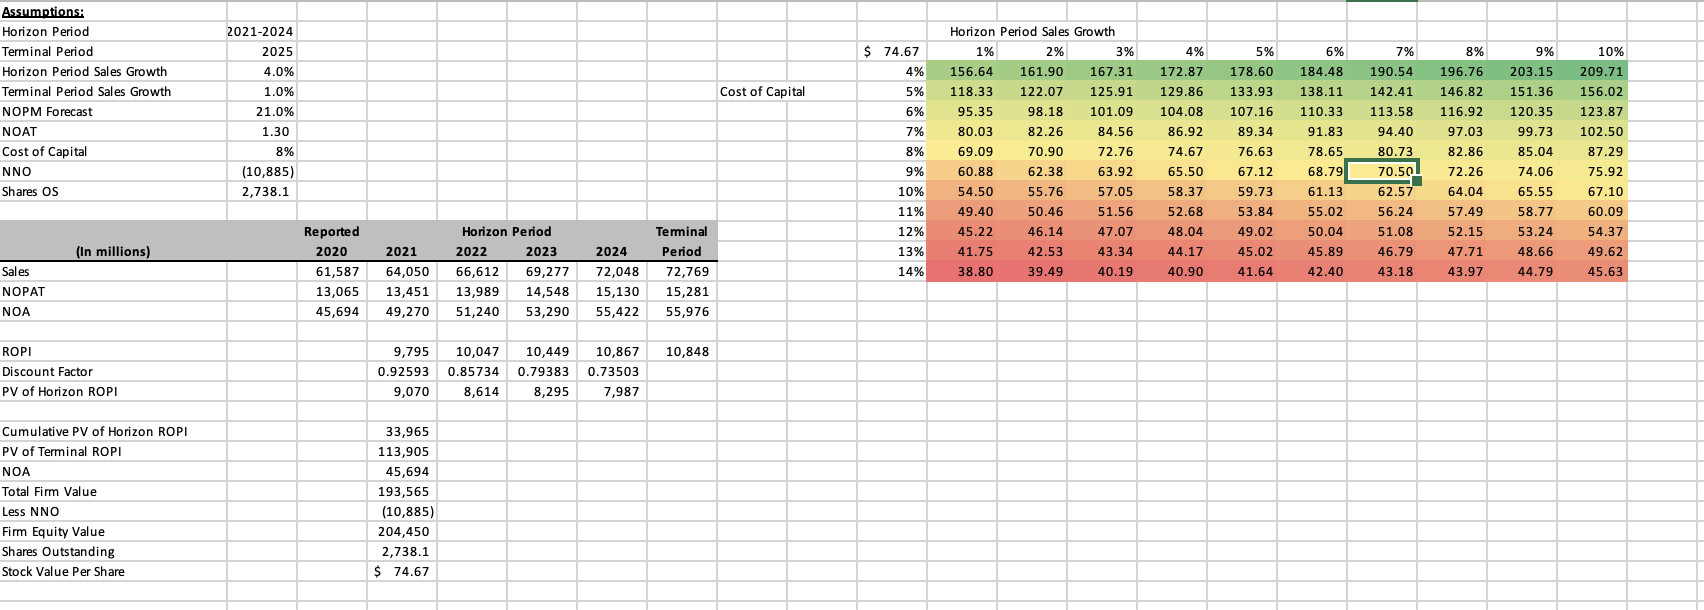
$ 74.67 6% 9% 4% 184.48 Cost of Capital Assumptions: Horizon Period Terminal Period Horizon Period Sales Growth Terminal Period Sales Growth NOPM Forecast NOAT Cost of Capital NNO Shares OS 5% 2021-2024 2025 4.0% 1.0% 21.0% 1.30 8% (10,885) 2,738.1 7% % 190.54 142.41 113.58 Horizon Period Sales Growth 1% 2% 3% 156.64 161.90 167.31 118.33 122.07 125.91 95.35 98.18 101.09 80.03 82.26 84.56 69.09 70.90 72.76 60.88 62.38 63.92 54.50 55.76 57.05 4% 172.87 129.86 104.08 86.92 74.67 5% 178.60 133.93 107.16 89.34 76.63 67.12 59.73 8% % 196.76 146.82 116.92 97.03 203.15 151.36 120.35 99.73 6% 10% 209.71 156.02 123.87 102.50 94.40 82.86 85.04 138.11 110.33 91.83 78.65 68.79 61.13 55.02 50.04 65.50 80.73 70.50 62.57 74.06 7% 8% 9% 10% 11% 12% 13% 14% % 65.55 87.29 75.92 67.10 60.09 72.26 64.04 57.49 52.15 58.37 52.68 48.04 50.46 46.14 56.24 51.08 Horizon Period 53.84 49.02 45.02 54.37 49.40 45.22 41.75 38.80 51.56 47.07 43.34 40.19 (In millions) 58.77 53.24 48.66 44.79 Reported 2020 61,587 13,065 45,694 46.79 49.62 42.53 39.49 Terminal Period 72,769 15,281 55,976 44.17 40.90 45.89 42.40 47.71 43.97 41.64 Sales NOPAT NOA 43.18 45.63 2021 64,050 13,451 49,270 2022 66,612 13,989 51,240 2023 69,277 14,548 53,290 2024 72,048 15,130 55,422 10,848 ROPI Discount Factor PV of Horizon ROPI 9,795 0.92593 9,070 10,047 0.85734 8,614 10,449 10,867 0.79383 0.73503 8,295 7,987 Cumulative PV of Horizon ROPI PV of Terminal ROPI NOA Total Firm Value Less NNO Firm Equity Value Shares Outstanding Stock Value Per Share 33,965 113,905 45,694 193,565 (10,885) 204,450 2,738.1 $ 74.67
Step by Step Solution
There are 3 Steps involved in it

Get step-by-step solutions from verified subject matter experts