

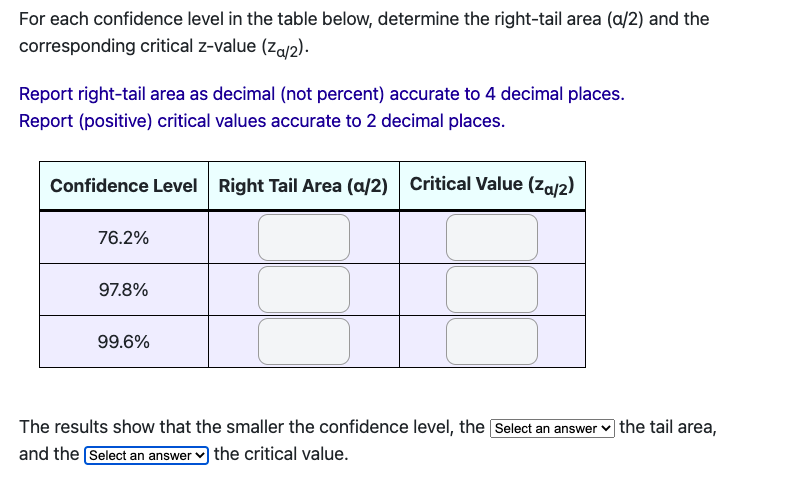
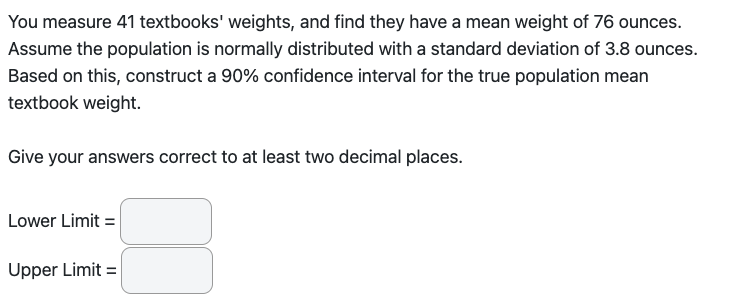
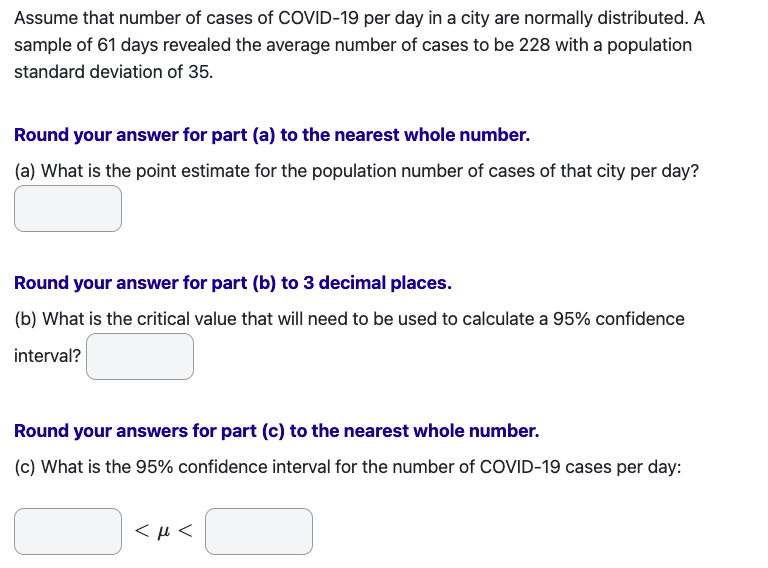
Question: The confidence interval for the population mean is often presented as Lower Limit The confidence interval for the population mean is often presented as Lower
The confidence interval for the population mean is often presented as Lower Limit
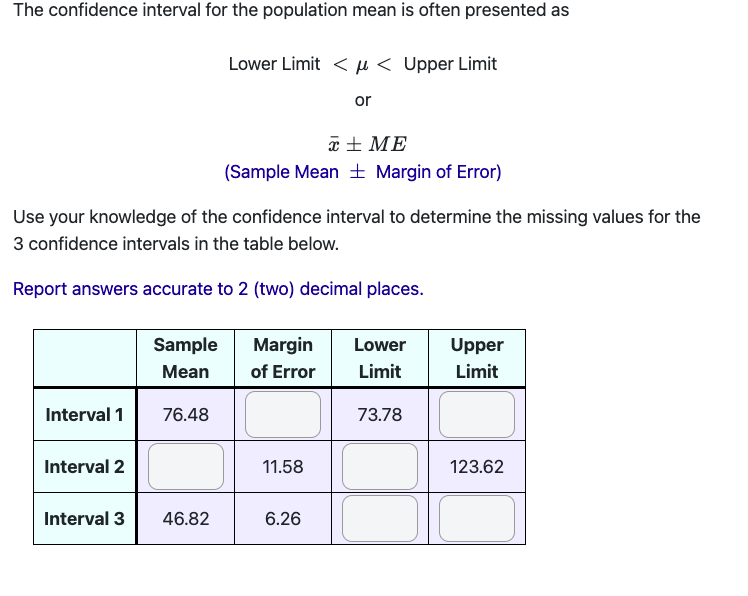
The confidence interval for the population mean is often presented as Lower Limit < < Upper Limit or (Sample Mean Margin of Error) Use your knowledge of the confidence interval to determine the missing values for the 3 confidence intervals in the table below. Report answers accurate to 2 (two) decimal places. Interval 1 Interval 2 Interval 3 Sample Mean 76.48 46.82 Margin of Error 11.58 6.26 Lower Limit 73.78 Upper Limit 123.62
Step by Step Solution
There are 3 Steps involved in it
1 Expert Approved Answer
Step: 1 Unlock

Question Has Been Solved by an Expert!
Get step-by-step solutions from verified subject matter experts
Step: 2 Unlock
Step: 3 Unlock