

Question: The control limits for a p chart were calculated by a statistician, who obtained that UCL = 0.13 and LCL = 0. Draw the p
 The control limits for a p chart were calculated by a statistician, who obtained that UCL = 0.13 and LCL = 0. Draw the p chart.
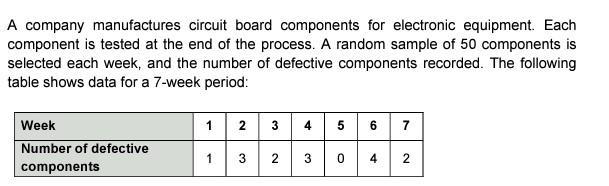
A company manufactures circuit board components for electronic equipment. Each component is tested at the end of the process. A random sample of 50 components is selected each week, and the number of defective components recorded. The following table shows data for a 7-week period: Week Number of defective components 1 3 2 3 0 4 2
Step by Step Solution
There are 3 Steps involved in it
Sure right here is the solution on your query Control Chart for Circuit Board Component Defects A pchart is a form of control chart used to display th... View full answer

Get step-by-step solutions from verified subject matter experts