

Question: Calculate the control limits for an x chart, based on the range. A quality engineer in charge of a coffee filter pack production line was
 Calculate the control limits for an x chart, based on the range.
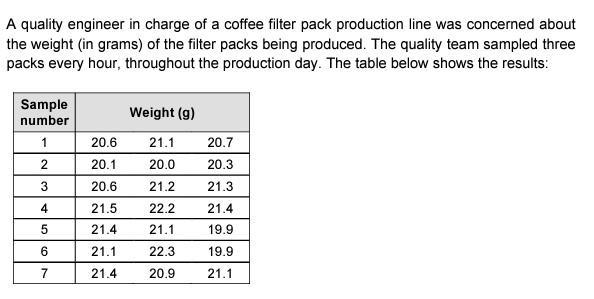
A quality engineer in charge of a coffee filter pack production line was concerned about the weight (in grams) of the filter packs being produced. The quality team sampled three packs every hour, throughout the production day. The table below shows the results: Sample number 1 2 3 4 5 6 7 20.6 20.1 20.6 21.5 21.4 21.1 21.4 Weight (g) 21.1 20.0 21.2 22.2 21.1 22.3 20.9 20.7 20.3 21.3 21.4 19.9 19.9 21.1
Step by Step Solution
3.48 Rating (158 Votes )
There are 3 Steps involved in it
Lets s solve this stepbystep 1 Find the range R for each sa... View full answer

Get step-by-step solutions from verified subject matter experts