

Question: The correct answer is sd=12.1 but I don't know how. My work looks like 20+29/2= 24.5 x 2=49 and so on to get all the
The correct answer is sd=12.1 but I don't know how. My work looks like 20+29/2= 24.5 x 2=49 and so on to get all the midpoint values then I add them all together to get the mean. Then I do (2x 49)^2 +(1x34.5)...... and then divide by the total frequency value to find the variance then I square root it to get standard deviation. But my answer is wrong and no where close to 12.1Please help.
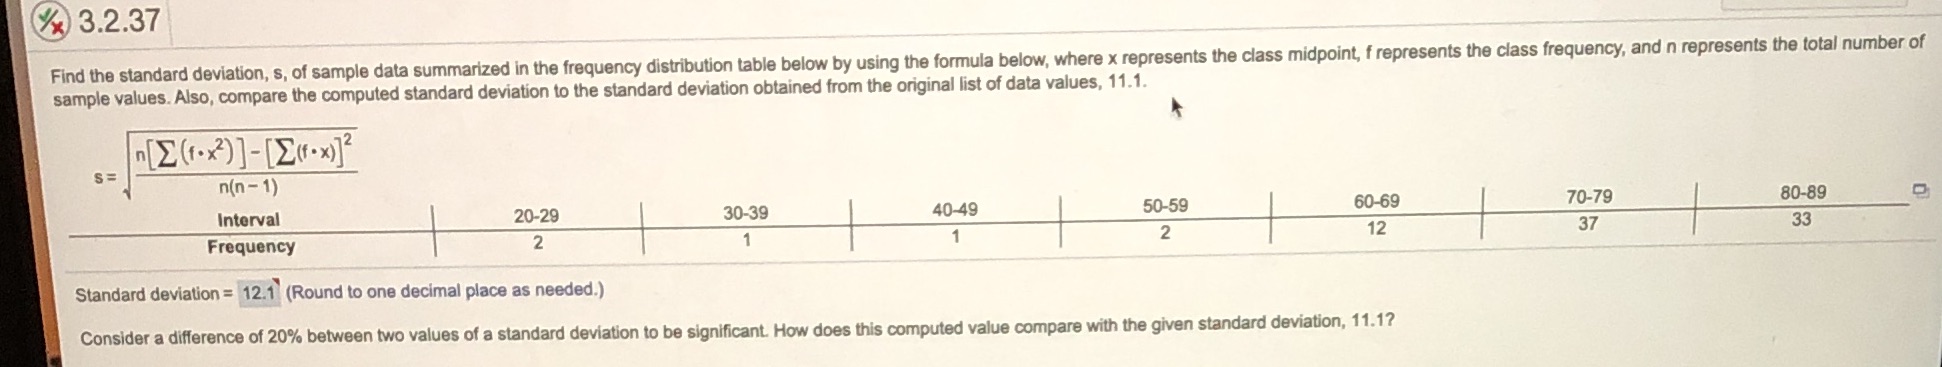
x) 3.2.37 Find the standard deviation, s, of sample data summarized in the frequency distribution table below by using the formula below, where x represents the class midpoint, f represents the class frequency, and n represents the total number of sample values. Also, compare the computed standard deviation to the standard deviation obtained from the original list of data values, 11.1. [E (fox) ]-[E(.x)]2 n(n- 1) Interval 20-29 30-39 40-49 50-59 60-69 70-79 80-89 Frequency 2 2 12 37 33 Standard deviation = 12.1 (Round to one decimal place as needed.) Consider a difference of 20% between two values of a standard deviation to be significant. How does this computed value compare with the given standard deviation, 1
Step by Step Solution
There are 3 Steps involved in it

Get step-by-step solutions from verified subject matter experts