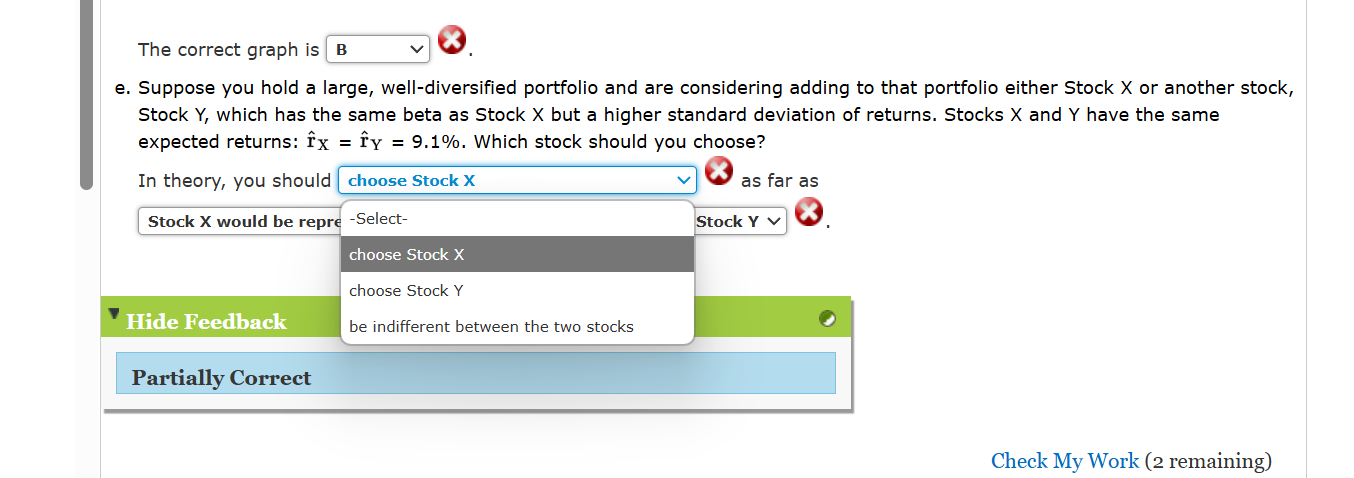
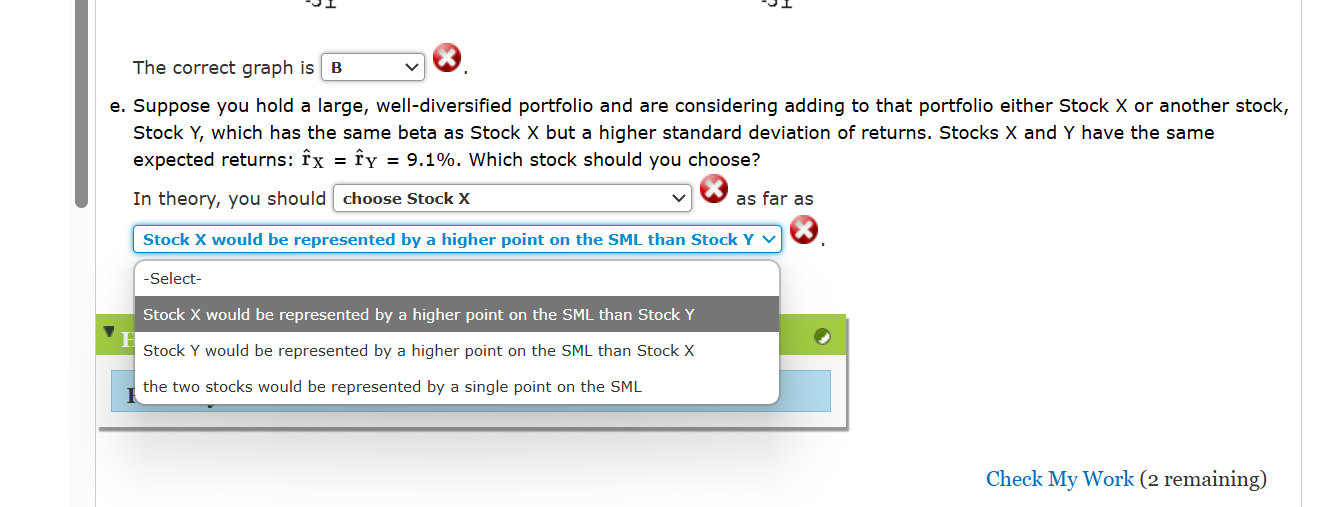
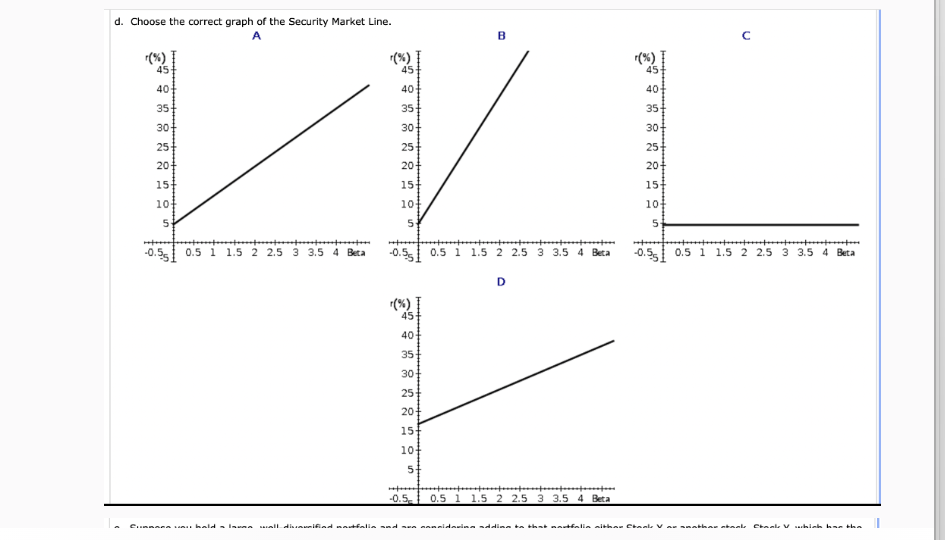
Question: The correct graph is| B v 0 e. Suppose you hold a large, well-diversified portfolio and are considering adding to that portfolio either Stock X

The correct graph is| B v 0 e. Suppose you hold aThe correct graph is| B v 0 e. Suppose you hold aThe correct graph is| B v 0 e. Suppose you hold aThe correct graph is| B v 0 e. Suppose you hold a
The correct graph is| B v 0 e. Suppose you hold a large, well-diversified portfolio and are considering adding to that portfolio either Stock X or another stock, Stock Y, which has the same beta as Stock X but a higher standard deviation of returns. Stocks X and Y have the same expected returns: Ix = I'y = 9.1%. Which stock should you choose? In theory, you should | choose Stock X v ] 0 as far as | Stock X would be repre -Select- Stock Y V.| 0 choose Stock X choose Stock Y be indifferent between the two stocks o Partially Correct Check My Work (2 remaining) The correct graph is | B v 0 e. Suppose you hold a large, well-diversified portfolio and are considering adding to that portfolio either Stock X or another stock, Stock Y, which has the same beta as Stock X but a higher standard deviation of returns. Stocks X and Y have the same expected returns: Tx = Ty = 9.1%. Which stock should you choose? In theory, you should | choose Stock X v:\\ 0 as far as ' Stock X would be represented by a higher point on the SML than Stock Y v ' 0 -Select- Stock X would be represented by a higher point on the SML than Stock Y 1 Stock Y would be represented by a higher point on the SML than Stock X the two stocks would be represented by a single point on the SML Check My Work (2 remaining) d. Choose the correct graph of the Security Market Line. A B () I C 45+ 45 40 45 40 40 35+ 35+ 30 351 30+ 25 30+ 25 20+ 25+ 20+ 15/ 20+ 15+ 10/ 15 10 104 -0.51 0.5 1 1.5 2 2.5 3 3.5 4 Beta -0.5 1 0.5 1 1.5 2 2.5 3 3.5 4 Beta -0.5 0.5 1 1.5 2 2.5 3 3.5 4 Beta D 45 404 35 30+ 25 20 15+ 104 5+ -0.5 { 0.5 1 1.5 2 2.5 3 3.5 4 Beta Cumnasa wait hald a lamas mall dluavelflad a notfalls and sea assaldans adding is that saifalla althas Class V as seathas steaks Chasks V sublets has thaCharacteristic Line and Security Market Line You are given the following set of data: Historical Rates of Return Year NYSE Stock X 1 -26.5% -20.0% 2 37.2 23.0 3 23.8 15.0 4 -T2 4.0 5 6.6 8.7 6 20.5 16.1 7 30.6 17.0 a. Use a spreadsheet (or a calculator with a linear regression function) to determine Stock X's beta coefficient. Do not round intermediate calculations. Round your answer to two decimal places. b. Determine the arithmetic average rates of return for Stock X and the NYSE over the period given, Calculate the standard deviations of returns for both Stock X and the NYSE. Do not round intermediate calculations. Round your answers to two decimal places, Stock X NYSE Average return, Favg % % Standard deviation, o e % . Assume that the situation during Years 1 to 7 is expected to prevail in the future {i.e., Fx = Ti Averager TM = TM_Averages 2nd both oy and by in the future will equal their past values). Also assume that Stock X Is In equilibrium - that Is, it plots on the Security Market Line. What Is the risk-free rate? Do not round intermediate calculations. Round your answer to two decimal places, %

Step by Step Solution

There are 3 Steps involved in it

1 Expert Approved Answer
Step: 1 Unlock blur-text-image
Question Has Been Solved by an Expert!

Get step-by-step solutions from verified subject matter experts

Step: 2 Unlock
Step: 3 Unlock

Students Have Also Explored These Related Finance Questions!