

Question: The correlation matrix below shows the correlation coefficients between several variables related to a business: Each cell in the table shows the correlation between two
The correlation matrix below shows the correlation coefficients between several variables related to a business:
Each cell in the table shows the correlation between two specific variables.
- If you consider the 0.7 as the threshold value, which variables are highly correlated to each other?
- What can you do to increase the speed and performance of a predictive model?
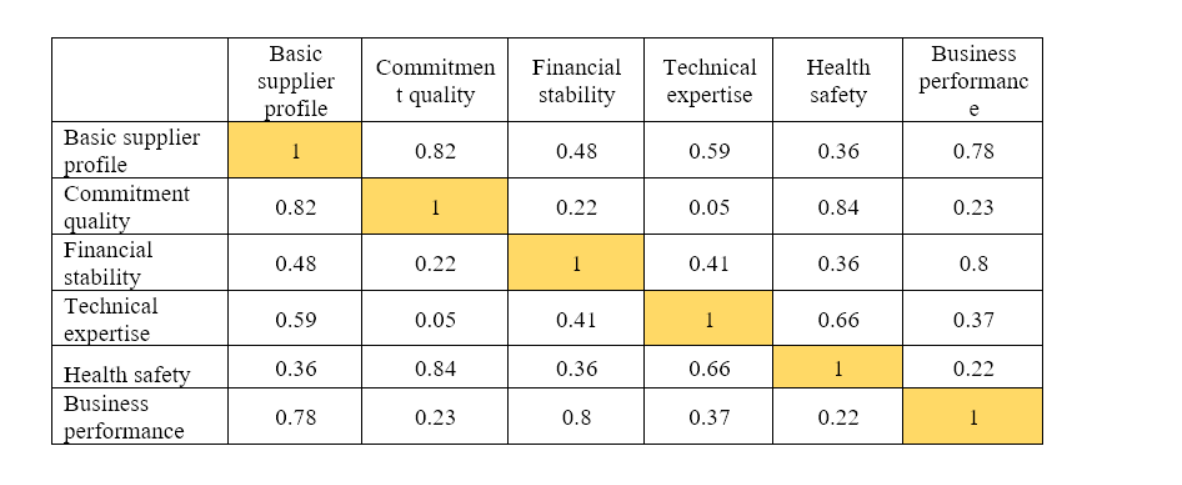
Basic Commitmen Financial Technical Health Business supplier profile t quality stability expertise safety performanc e Basic supplier 0.82 0.48 0.59 0.36 0.78 profile Commitment 0.82 1 0.22 0.05 0.84 0.23 quality Financial 0.48 0.22 1 0.41 stability 0.36 0.8 Technical 0.59 0.05 0.41 1 0.66 0.37 expertise Health safety 0.36 0.84 0.36 0.66 1 0.22 Business 0.78 0.23 0.8 0.37 performance 0.22
Step by Step Solution
There are 3 Steps involved in it
1 Expert Approved Answer
Step: 1 Unlock

Question Has Been Solved by an Expert!
Get step-by-step solutions from verified subject matter experts
Step: 2 Unlock
Step: 3 Unlock