

Question: The cost data for a rm producing baseball bats appear below. Of the total cost, $25,600 is xed at all levels of output. The bats
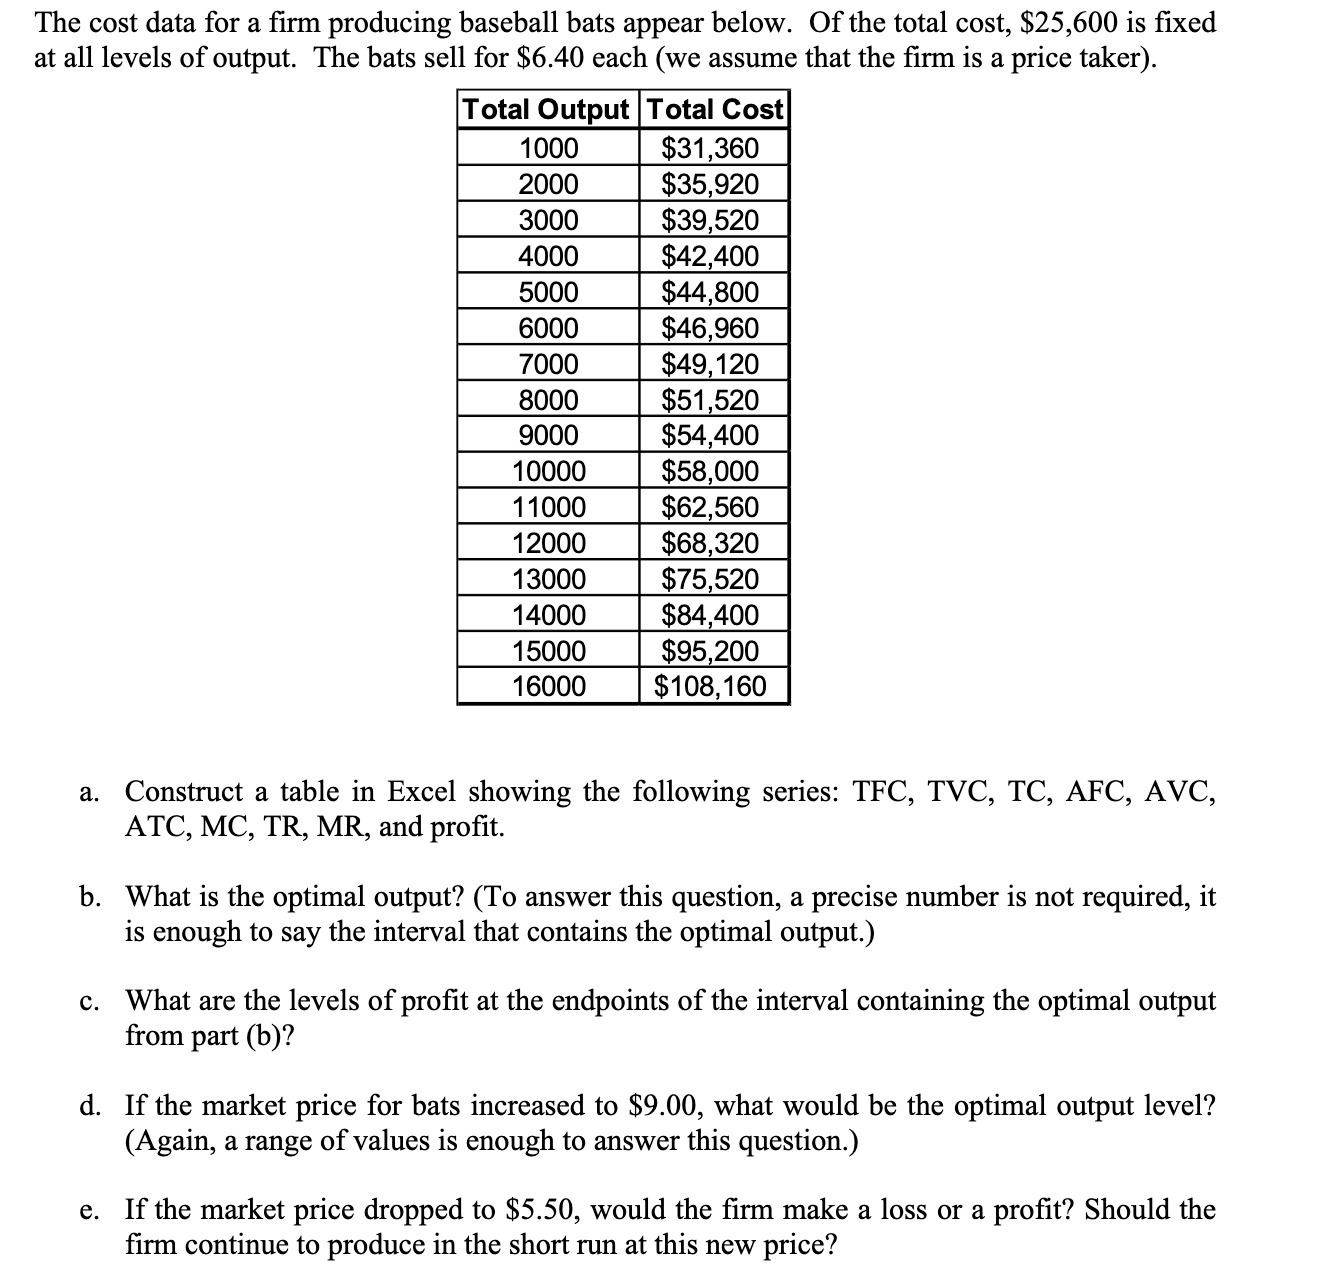

The cost data for a rm producing baseball bats appear below. Of the total cost, $25,600 is xed at all levels of output. The bats sell for $6.40 each (we assume that the rm is a price taker). \" 4000 $42,400 $44,800 $46,960 $49,120 $51 520 $54,400 $58,000 $62,560 $88,320 $75,520 $84,400 $95 200 $108,180 6000 7000 8000 9000 10000 11000 1 3000 14000 1 6000 a. Construct a table in Excel showing the following series: TFC, TVC, TC, AFC, AVC, ATC, MC, TR, MR, and prot. b. What is the optimal output? (To answer this question, a precise number is not required, it is enough to say the interval that contains the optimal output.) c. What are the levels of prot at the endpoints of the interval containing the optimal output from part (b)? d. If the market price for bats increased to $9.00, what would be the optimal output level? (Again, a range of values is enough to answer this question.) e. If the market price dropped to $5.50, would the rm make a loss or a prot? Should the rm continue to produce in the short run at this new price
Step by Step Solution
There are 3 Steps involved in it

Get step-by-step solutions from verified subject matter experts