

Question: The cumulative RTD for two different packed-bed reactors had the shapes shown in Figure P-1a and Figure P-1b. What could we conclude about each reactor?
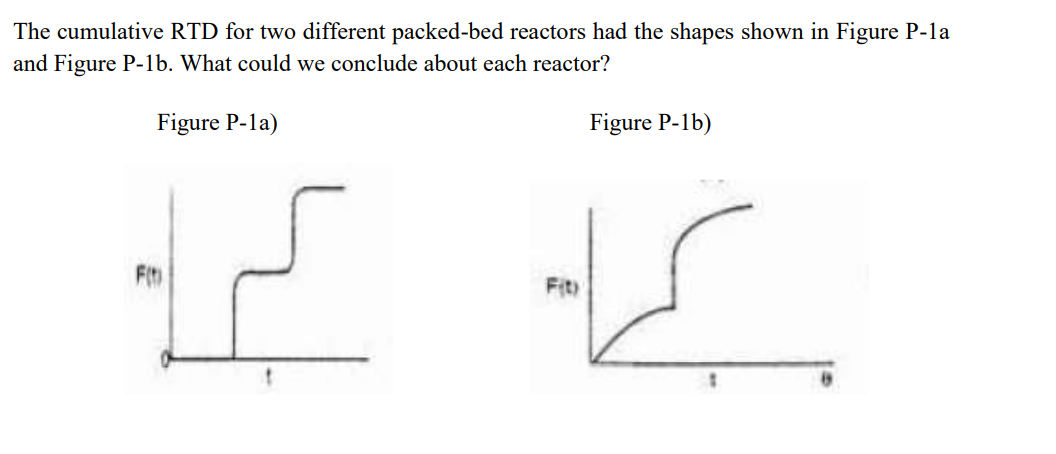
The cumulative RTD for two different packed-bed reactors had the shapes shown in Figure P-1a and Figure P-1b. What could we conclude about each reactor? Figure P-1a) Figure P1b)
Step by Step Solution
There are 3 Steps involved in it
1 Expert Approved Answer
Step: 1 Unlock

Question Has Been Solved by an Expert!
Get step-by-step solutions from verified subject matter experts
Step: 2 Unlock
Step: 3 Unlock