

Question: The daily net cash flows in the table below represent a 5-day sample. Use the Data Analysis tool in Excel to calculate the 95% and
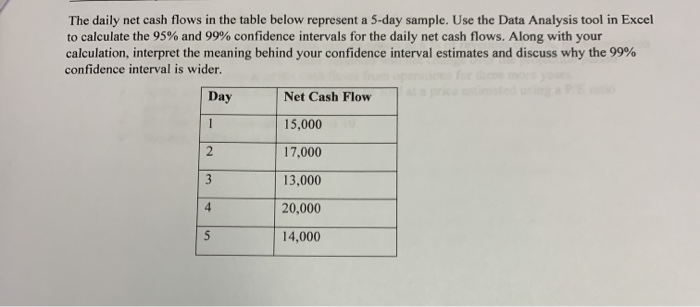
The daily net cash flows in the table below represent a 5-day sample. Use the Data Analysis tool in Excel to calculate the 95% and 99% confidence intervals for the daily net cash flows. Along with your calculation, interpret the meaning behind your confidence interval estimates and discuss why the 99% confidence interval is wider. Day Net Cash Flow 15,000 17,000 13,000 20,000 14,000
Step by Step Solution
There are 3 Steps involved in it
1 Expert Approved Answer
Step: 1 Unlock

Question Has Been Solved by an Expert!
Get step-by-step solutions from verified subject matter experts
Step: 2 Unlock
Step: 3 Unlock